| Note: This tutorial assumes that you have completed the previous tutorials: understanding ROS nodes. |
| |
Understanding ROS Topics
Description: This tutorial introduces ROS topics as well as using the rostopic and rqt_plot commandline tools.Tutorial Level: BEGINNER
Next Tutorial: Understanding ROS services and parameters
Contents
Setup
roscore
Let's start by making sure that we have roscore running, in a new terminal:
$ roscore
If you left roscore running from the last tutorial, you may get the error message:
roscore cannot run as another roscore/master is already running.
Please kill other roscore/master processes before relaunching
This is fine. Only one roscore needs to be running.
turtlesim
For this tutorial we will also use turtlesim. Please run in a new terminal:
$ rosrun turtlesim turtlesim_node
turtle keyboard teleoperation
We'll also need something to drive the turtle around with. Please run in a new terminal:
$ rosrun turtlesim turtle_teleop_key
[ INFO] 1254264546.878445000: Started node [/teleop_turtle], pid [5528], bound on [aqy], xmlrpc port [43918], tcpros port [55936], logging to [~/ros/ros/log/teleop_turtle_5528.log], using [real] time
Reading from keyboard
---------------------------
Use arrow keys to move the turtle.
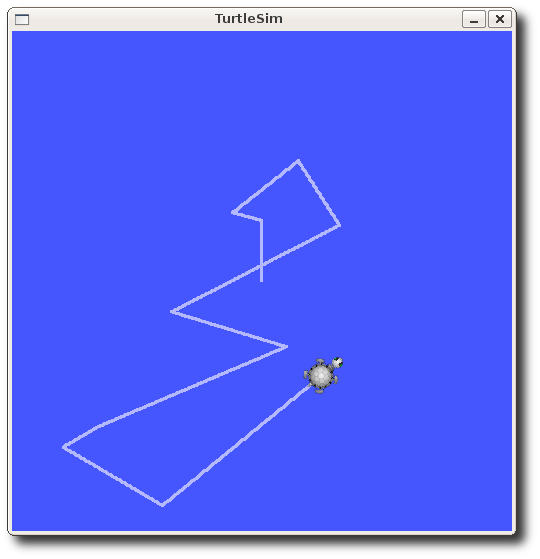
Now you can use the arrow keys of the keyboard to drive the turtle around. If you can not drive the turtle select the terminal window of the turtle_teleop_key to make sure that the keys that you type are recorded.
Now that you can drive your turtle around, let's look at what's going on behind the scenes.
ROS Topics
The turtlesim_node and the turtle_teleop_key node are communicating with each other over a ROS Topic. turtle_teleop_key is publishing the key strokes on a topic, while turtlesim subscribes to the same topic to receive the key strokes. Let's use rqt_graph which shows the nodes and topics currently running.
Note: If you're using electric or earlier, rqt is not available. Use rxgraph instead.
Using rqt_graph
rqt_graph creates a dynamic graph of what's going on in the system. rqt_graph is part of the rqt package. Unless you already have it installed, run:
$ sudo apt-get install ros-<distro>-rqt
$ sudo apt-get install ros-<distro>-rqt-common-plugins
replacing <distro> with the name of your ROS distribution (e.g. indigo, jade, kinetic, lunar ...)
In a new terminal:
$ rosrun rqt_graph rqt_graph
You will see something similar to:

If you place your mouse over /turtle1/command_velocity it will highlight the ROS nodes (here blue and green) and topics (here red). As you can see, the turtlesim_node and the turtle_teleop_key nodes are communicating on the topic named /turtle1/command_velocity.

Introducing rostopic
The rostopic tool allows you to get information about ROS topics.
You can use the help option to get the available sub-commands for rostopic
$ rostopic -h
rostopic bw     display bandwidth used by topic
rostopic echo   print messages to screen
rostopic hz     display publishing rate of topic
rostopic list   print information about active topics
rostopic pub    publish data to topic
rostopic type   print topic type
Or pressing tab key after rostopic prints the possible sub-commands:
$ rostopic
bw    echo  find  hz    info  list  pub   type
Let's use some of these topic sub-commands to examine turtlesim.
Using rostopic echo
rostopic echo shows the data published on a topic.
Usage:
rostopic echo [topic]
Let's look at the command velocity data published by the turtle_teleop_key node.
For ROS Hydro and later, this data is published on the /turtle1/cmd_vel topic. In a new terminal, run:
$ rostopic echo /turtle1/cmd_vel
For ROS Groovy and earlier, this data is published on the /turtle1/command_velocity topic. In a new terminal, run:
$ rostopic echo /turtle1/command_velocity
You probably won't see anything happen because no data is being published on the topic. Let's make turtle_teleop_key publish data by pressing the arrow keys. Remember if the turtle isn't moving you need to select the turtle_teleop_key terminal again.
For ROS Hydro and later, you should now see the following when you press the up key:
linear:
  x: 2.0
  y: 0.0
  z: 0.0
angular:
  x: 0.0
  y: 0.0
  z: 0.0
---
linear:
  x: 2.0
  y: 0.0
  z: 0.0
angular:
  x: 0.0
  y: 0.0
  z: 0.0
---
For ROS Groovy and earlier, you should now see the following when you press the up key:
---
linear: 2.0
angular: 0.0
---
linear: 2.0
angular: 0.0
---
linear: 2.0
angular: 0.0
---
linear: 2.0
angular: 0.0
---
linear: 2.0
angular: 0.0
Now let's look at rqt_graph again. Press the refresh button in the upper-left to show the new node. As you can see rostopic echo, shown here in red, is now also subscribed to the turtle1/command_velocity topic.

Using rostopic list
rostopic list returns a list of all topics currently subscribed to and published.
Let's figure out what argument the list sub-command needs. In a new terminal run:
$ rostopic list -h
Usage: rostopic list [/topic]

Options:
  -h, --help            show this help message and exit
  -b BAGFILE, --bag=BAGFILE
                        list topics in .bag file
  -v, --verbose         list full details about each topic
  -p                    list only publishers
  -s                    list only subscribers
For rostopic list use the verbose option:
$ rostopic list -v
This displays a verbose list of topics to publish to and subscribe to and their type.
For ROS Hydro and later,
Published topics:
 * /turtle1/color_sensor [turtlesim/Color] 1 publisher
 * /turtle1/cmd_vel [geometry_msgs/Twist] 1 publisher
 * /rosout [rosgraph_msgs/Log] 2 publishers
 * /rosout_agg [rosgraph_msgs/Log] 1 publisher
 * /turtle1/pose [turtlesim/Pose] 1 publisher

Subscribed topics:
 * /turtle1/cmd_vel [geometry_msgs/Twist] 1 subscriber
 * /rosout [rosgraph_msgs/Log] 1 subscriber
For ROS Groovy and earlier,
Published topics:
 * /turtle1/color_sensor [turtlesim/Color] 1 publisher
 * /turtle1/command_velocity [turtlesim/Velocity] 1 publisher
 * /rosout [roslib/Log] 2 publishers
 * /rosout_agg [roslib/Log] 1 publisher
 * /turtle1/pose [turtlesim/Pose] 1 publisher

Subscribed topics:
 * /turtle1/command_velocity [turtlesim/Velocity] 1 subscriber
 * /rosout [roslib/Log] 1 subscriber
ROS Messages
Communication on topics happens by sending ROS messages between nodes. For the publisher (turtle_teleop_key) and subscriber (turtlesim_node) to communicate, the publisher and subscriber must send and receive the same type of message. This means that a topic type is defined by the message type published on it. The type of the message sent on a topic can be determined using rostopic type.
Using rostopic type
rostopic type returns the message type of any topic being published.
Usage:
rostopic type [topic]
For ROS Hydro and later,
- Try:
$ rostopic type /turtle1/cmd_vel
- You should get:
geometry_msgs/Twist
We can look at the details of the message using rosmsg:
$ rosmsg show geometry_msgs/Twist
geometry_msgs/Vector3 linear
  float64 x
  float64 y
  float64 z
geometry_msgs/Vector3 angular
  float64 x
  float64 y
  float64 z
- You should get:
For ROS Groovy and earlier,
- Try:
$ rostopic type /turtle1/command_velocity
- You should get:
turtlesim/Velocity
We can look at the details of the message using rosmsg:
$ rosmsg show turtlesim/Velocity
float32 linear
float32 angular
- You should get:
Now that we know what type of message turtlesim expects, we can publish commands to our turtle.
rostopic continued
Now that we have learned about ROS messages, let's use rostopic with messages.
Using rostopic pub
rostopic pub publishes data on to a topic currently advertised.
Usage:
rostopic pub [topic] [msg_type] [args]
For ROS Hydro and later, example:
$ rostopic pub -1 /turtle1/cmd_vel geometry_msgs/Twist -- '[2.0, 0.0, 0.0]' '[0.0, 0.0, 1.8]'
For ROS Groovy and earlier, example:
$ rostopic pub -1 /turtle1/command_velocity turtlesim/Velocity -- 2.0 1.8
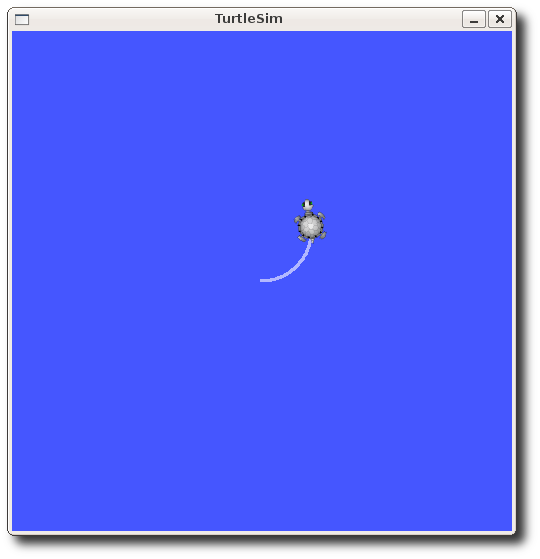
The previous command will send a single message to turtlesim telling it to move with a linear velocity of 2.0, and an angular velocity of 1.8 .
This is a pretty complicated example, so lets look at each argument in detail.
For ROS Hydro and later,
This command will publish messages to a given topic:
rostopic pub
This option (dash-one) causes rostopic to only publish one message then exit:
-1
This is the name of the topic to publish to:
/turtle1/cmd_vel
This is the message type to use when publishing to the topic:
geometry_msgs/Twist
This option (double-dash) tells the option parser that none of the following arguments is an option. This is required in cases where your arguments have a leading dash -, like negative numbers.
--
As noted before, a geometry_msgs/Twist msg has two vectors of three floating point elements each: linear and angular. In this case, '[2.0, 0.0, 0.0]' becomes the linear value with x=2.0, y=0.0, and z=0.0, and '[0.0, 0.0, 1.8]' is the angular value with x=0.0, y=0.0, and z=1.8. These arguments are actually in YAML syntax, which is described more in the YAML command line documentation.
'[2.0, 0.0, 0.0]' '[0.0, 0.0, 1.8]'
For ROS Groovy and earlier,
This command will publish messages to a given topic:
rostopic pub
This option (dash-one) causes rostopic to only publish one message then exit:
-1
This is the name of the topic to publish to:
/turtle1/command_velocity
This is the message type to use when publishing to the topic:
turtlesim/Velocity
This option (double-dash) tells the option parser that none of the following arguments is an option. This is required in cases where your arguments have a leading dash -, like negative numbers.
--
As noted before, a turtlesim/Velocity msg has two floating point elements : linear and angular. In this case, 2.0 becomes the linear value, and 1.8 is the angular value. These arguments are actually in YAML syntax, which is described more in the YAML command line documentation.
2.0 1.8
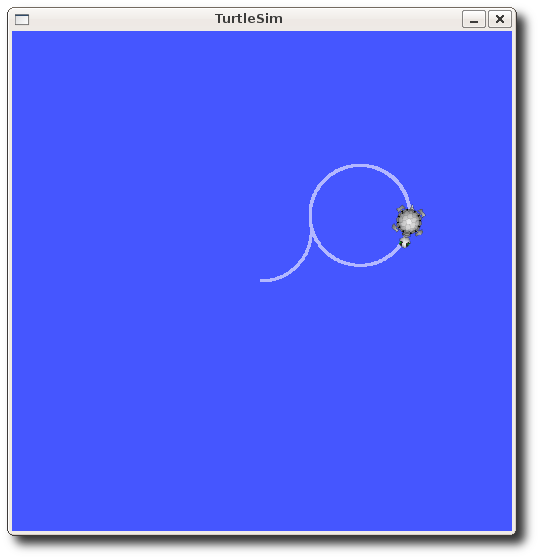
You may have noticed that the turtle has stopped moving; this is because the turtle requires a steady stream of commands at 1 Hz to keep moving. We can publish a steady stream of commands using rostopic pub -r command:
For ROS Hydro and later,
$ rostopic pub /turtle1/cmd_vel geometry_msgs/Twist -r 1 -- '[2.0, 0.0, 0.0]' '[0.0, 0.0, -1.8]'
For ROS Groovy and earlier,
$ rostopic pub /turtle1/command_velocity turtlesim/Velocity -r 1 -- 2.0 -1.8
This publishes the velocity commands at a rate of 1 Hz on the velocity topic.
We can also look at what is happening in rqt_graph. Press the refresh button in the upper-left. The rostopic pub node (here in red) is communicating with the rostopic echo node (here in green):

As you can see the turtle is running in a continuous circle. In a new terminal, we can use rostopic echo to see the data published by our turtlesim:
rostopic echo /turtle1/pose
Using rostopic hz
rostopic hz reports the rate at which data is published.
Usage:
rostopic hz [topic]
Let's see how fast the turtlesim_node is publishing /turtle1/pose:
$ rostopic hz /turtle1/pose
You will see:
subscribed to [/turtle1/pose]
average rate: 59.354
        min: 0.005s max: 0.027s std dev: 0.00284s window: 58
average rate: 59.459
        min: 0.005s max: 0.027s std dev: 0.00271s window: 118
average rate: 59.539
        min: 0.004s max: 0.030s std dev: 0.00339s window: 177
average rate: 59.492
        min: 0.004s max: 0.030s std dev: 0.00380s window: 237
average rate: 59.463
        min: 0.004s max: 0.030s std dev: 0.00380s window: 290
Now we can tell that the turtlesim is publishing data about our turtle at the rate of 60 Hz. We can also use rostopic type in conjunction with rosmsg show to get in depth information about a topic:
For ROS Hydro and later,
$ rostopic type /turtle1/cmd_vel | rosmsg show
For ROS Groovy and earlier,
$ rostopic type /turtle1/command_velocity | rosmsg show
Now that we've examined the topics using rostopic let's use another tool to look at the data published by our turtlesim:
Using rqt_plot
Note: If you're using electric or earlier, rqt is not available. Use rxplot instead.
rqt_plot displays a scrolling time plot of the data published on topics. Here we'll use rqt_plot to plot the data being published on the /turtle1/pose topic. First, start rqt_plot by typing
$ rosrun rqt_plot rqt_plot
in a new terminal. In the new window that should pop up, a text box in the upper left corner gives you the ability to add any topic to the plot. Typing /turtle1/pose/x will highlight the plus button, previously disabled. Press it and repeat the same procedure with the topic /turtle1/pose/y. You will now see the turtle's x-y location plotted in the graph.
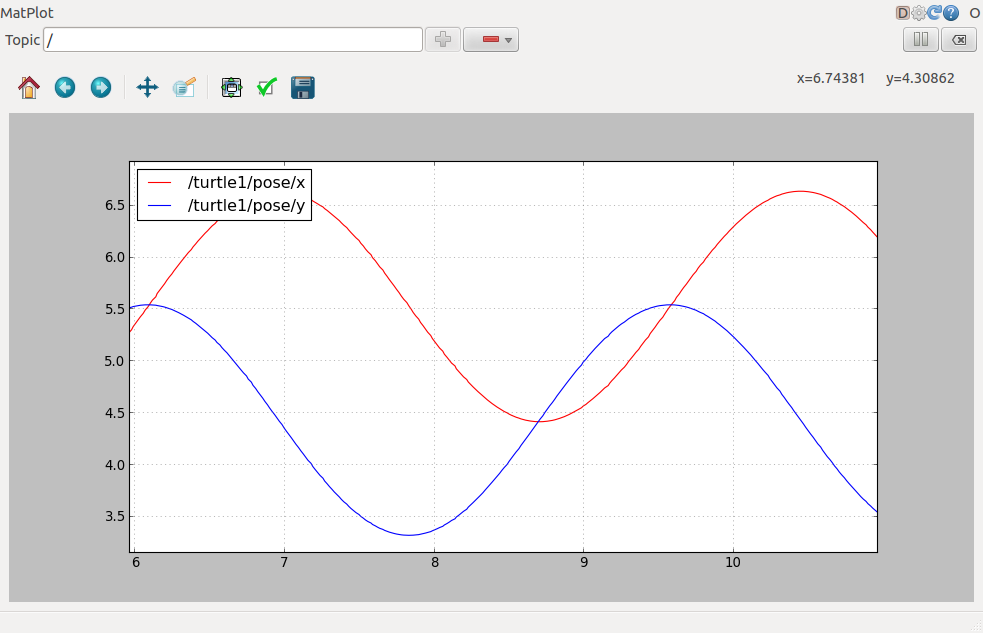
Pressing the minus button shows a menu that allows you to hide the specified topic from the plot. Hiding both the topics you just added and adding /turtle1/pose/theta will result in the plot shown in the next figure.
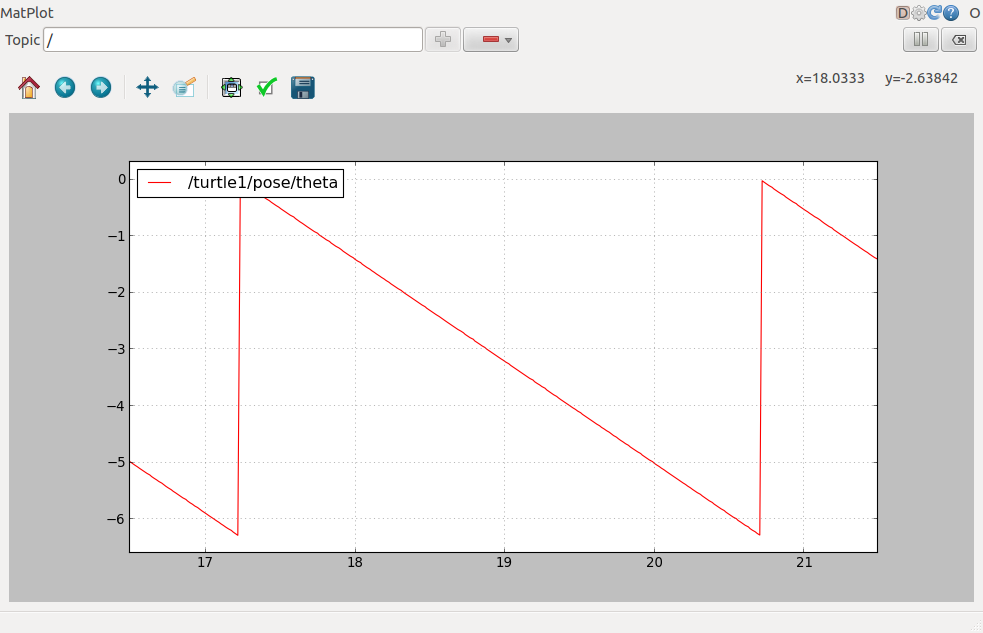
That's it for this section, use Ctrl-C to kill the rostopic terminals but keep your turtlesim running.
Now that you understand how ROS topics work, let's look at how services and parameters work.
Video Tutorial
The following video presents a small tutorial using turtlesim on ROS nodes and ROS topics
