| |
Getting Started with ECHO ONE
Description: Using the Toposens stack to connect to and display data from Toposens 3D ultrasonic sensorsKeywords: Toposens, ECHO ONE, TS3, ultrasound
Tutorial Level: BEGINNER
Contents
This tutorial assumes that Ubuntu 18.04 is being used with ROS Melodic.
Build Driver
Clone the toposens metapackage into your catkin workspace:
$ cd ~/catkin_ws/src
$ git clone https://gitlab.com/toposens/public/ros-packages.git
Use rosdep to install missing dependencies:
$ rosdep update
$ rosdep install --from-paths ~/catkin_ws/src/ros-packages/ --ignore-src --rosdistro melodic -y
Build the package by using catkin build:
$ catkin build toposens
Enable Serial Port Permissions
Add yourself to the “dialout” group:
$ sudo adduser $USER dialout
Trigger updated group permissions to take effect:
$ newgrp dialout
Re-login or reboot for the updated group permissions to take effect permanently.
Connect TS3 Sensor
Connect your Toposens TS3 sensor via the provided FTDI cable to any available USB port on your computer.
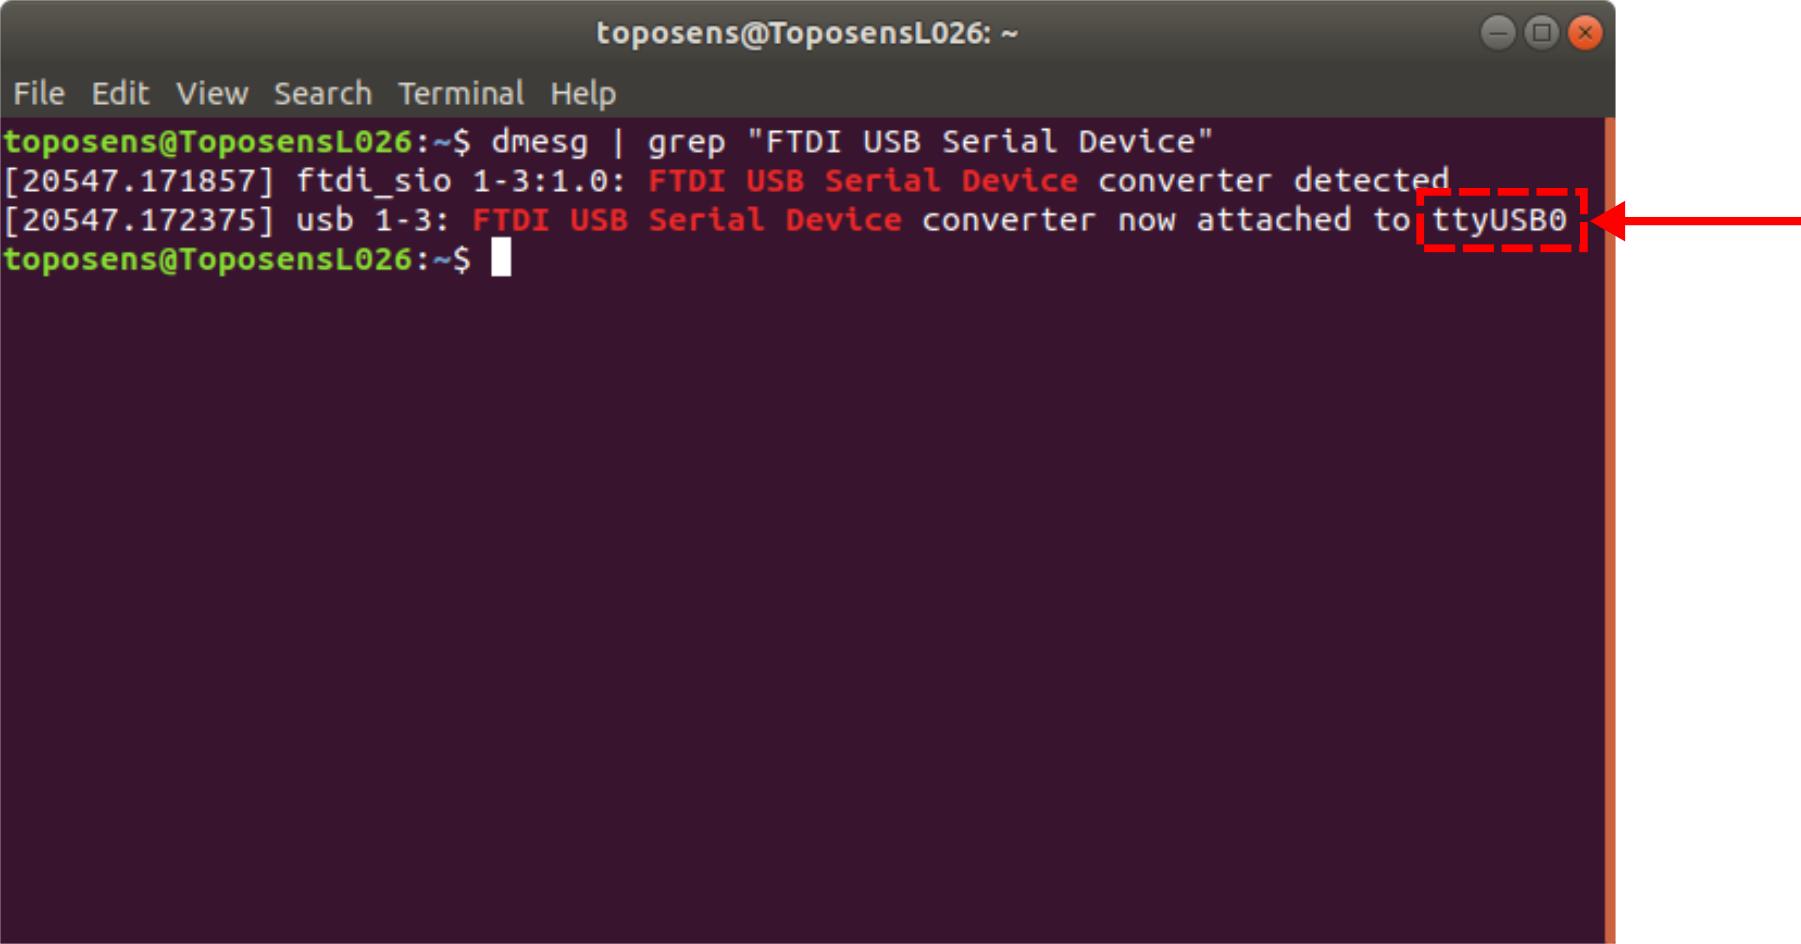
Obtain the connected terminal ID for the device:
$ dmesg | grep "FTDI USB Serial Device"

In this case the terminal ID would be ttyUSB0.
Visualize Data
There are three different ways of viewing the data processed by a TS3 sensor. They are explained in the following.
View Raw Stream
The ts_driver_node translates the sensor data into custom toposens_msgs/TsScan messages.
Launch the driver node and start accruing data from a TS3 sensor. Set the corresponding serial port as launch argument (here: /dev/ttyUSB0):
$ roslaunch toposens_driver toposens_driver.launch port:=/dev/ttyUSB0
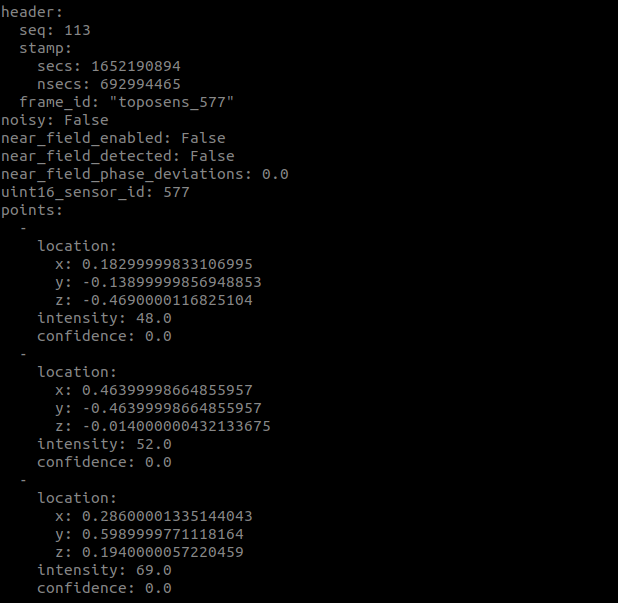
The sensor data is published to the the topic /ts_scans. View the incoming scans with:
$ rostopic echo /ts_scans

Visualize Data as Markers
The ts_markers_node translates the messages of type toposens_msgs/TsScan into messages of type visualization_msgs/MarkerArray.
The driver node as well as the markers node are launched from within one launch-file:
$ roslaunch toposens_markers toposens_markers.launch port:=/dev/ttyUSB0
The markers are visualized in RViz: ![]()
View Pointcloud
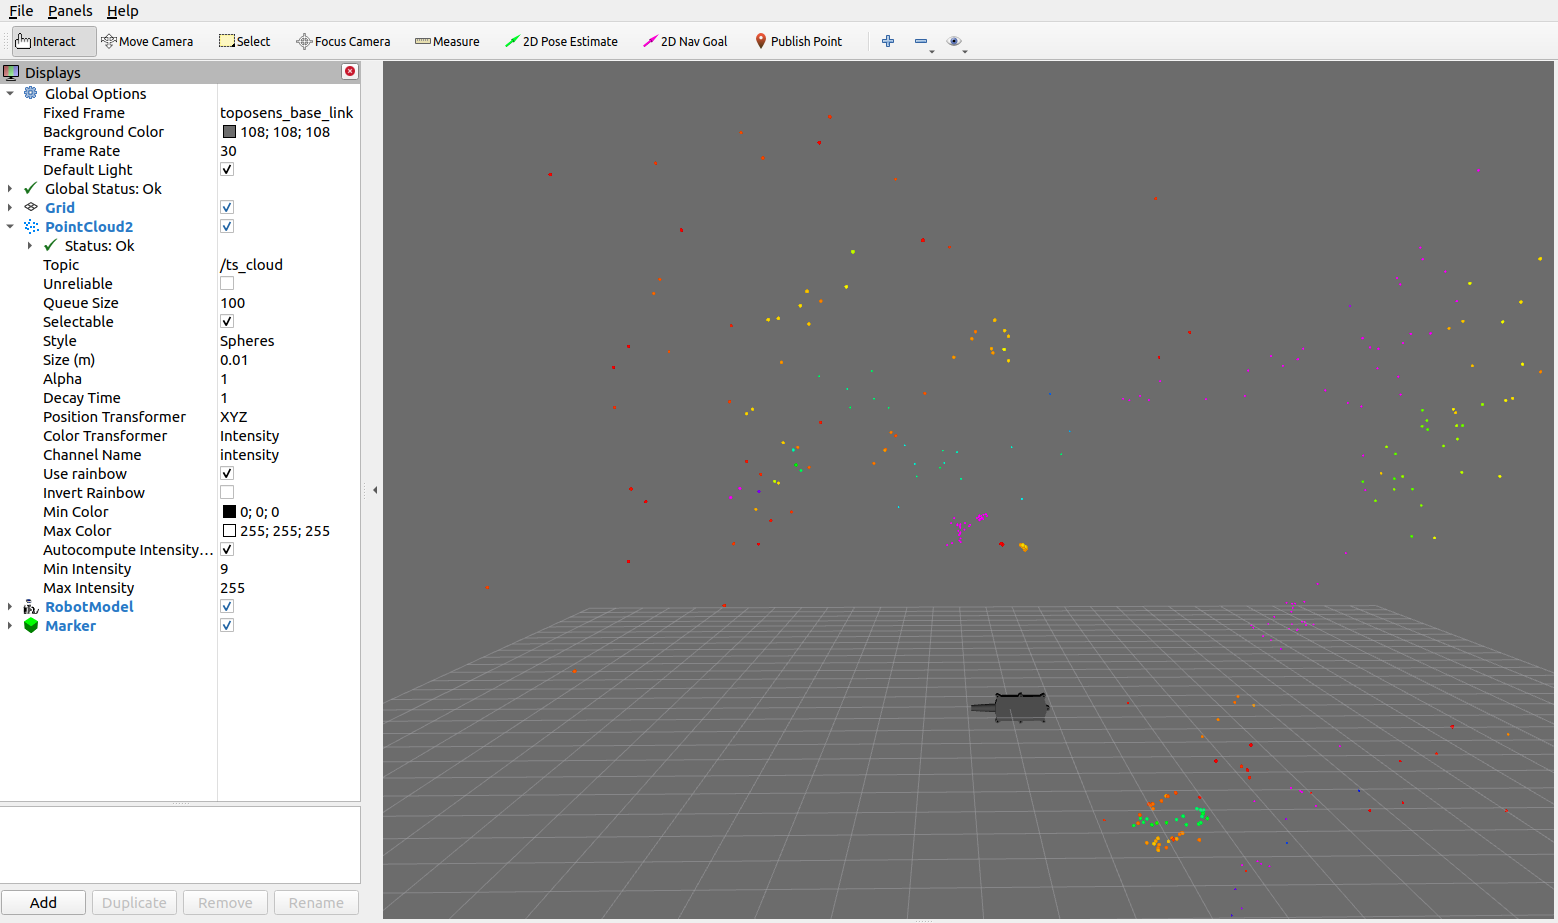
The ts_cloud_node translates the messages of type toposens_msgs/TsScan into messages of type sensor_msgs/PointCloud2.
The driver node as well as the pointcloud node are launched from within one launch-file:
$ roslaunch toposens_pointcloud toposens_cloud.launch port:=/dev/ttyUSB0
The pointcloud is visualized in RViz: 
Manipulate Parameters
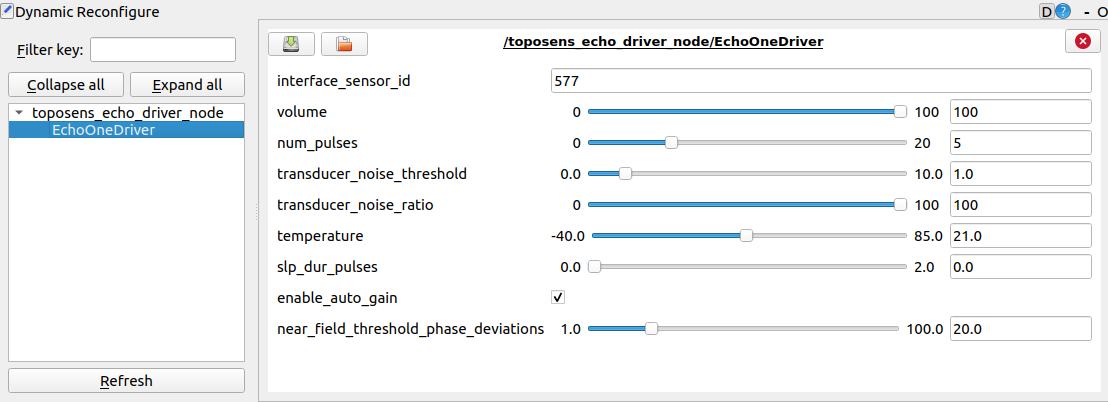
To manipulate sensor parameters as well as visualization parameters live in realtime, run in an additional terminal window:
$ rosrun rqt_reconfigure rqt_reconfigure
The ts_driver_node respectively ts_markers_node need to be running for this to work.
Sensor Parameters
There are 6 different parameters that can be changed in the ts_driver_node.

Variable Name |
Effect |
num_pulse |
Number of ultrasonic pulses emitted by the sensors piezo transducer in every transmission cycle. Increasing the value will detect objects that are further away, decreasing it will increase the precision in short range. |
peak_detection_window |
Kernel size applied on ADC signals for peak detection. Decreasing it will separate multiple objects that are close to each other. |
echo_rejection_threshold |
Minimum amplitude for an echo to be considered valid. Increasing it will ignore more points of smaller intensity. |
use_external_temperature |
If checked uses external temperature sensor to calibrate speed-of-sound, otherwise use value provided by ambient_temperature variable. |
ambient_temperature |
Temperature value used to calibrate speed-of-sound. Value is only used if use_external_temperature is checked. |
noise_indicator_threshold |
Normalized noise level on ADC signals to mark processed points as noisy. |
Marker Parameters
There are 2 parameters that can be changed in the ts_markers_node.


