| Note: This tutorial assumes that you have completed the previous tutorials: Comprendiendo Nodos ROS. |
| |
Comprendiendo Tópicos ROS
Description: Este tutorial es una introducción a los Tópicos de ROS y al uso de las herramientas de línea de comando rostopic y rqt_plot.Tutorial Level: BEGINNER
Next Tutorial: Comprendiendo Servicios y Parametros ROS
Contents
Setup
roscore
Let's start by making sure that we have roscore running, in a new terminal:
$ roscore
If you left roscore running from the last tutorial, you may get the error message:
roscore cannot run as another roscore/master is already running.
Please kill other roscore/zenmaster processes before relaunching
This is fine. Only one roscore needs to be running.
turtlesim
For this tutorial we will also use turtlesim. Please run in a new terminal:
$ rosrun turtlesim turtlesim_node
turtle keyboard teleoperation
We'll also need something to drive the turtle around with. Please run in a new terminal:
$ rosrun turtle_teleop teleop_turtle_key
[ INFO] 1254264546.878445000: Started node [/teleop_turtle], pid [5528], bound on [aqy], xmlrpc port [43918], tcpros port [55936], logging to [~/ros/ros/log/teleop_turtle_5528.log], using [real] time
Reading from keyboard
---------------------------
Use arrow keys to move the turtle.
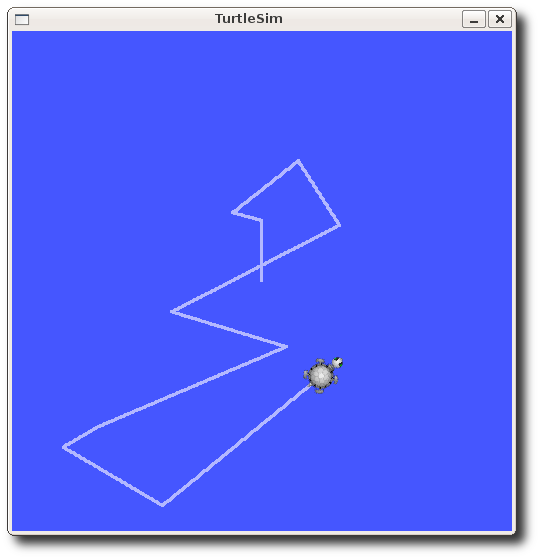
Now you can use the arrow keys of the keyboard to drive the turtle around. If you can not drive the turtle select the terminal window of the turtle_teleop_key to make sure that the keys that you type are recorded.
Now that you can drive your turtle around, let's look at what's going on behind the scenes.
ROS Topics
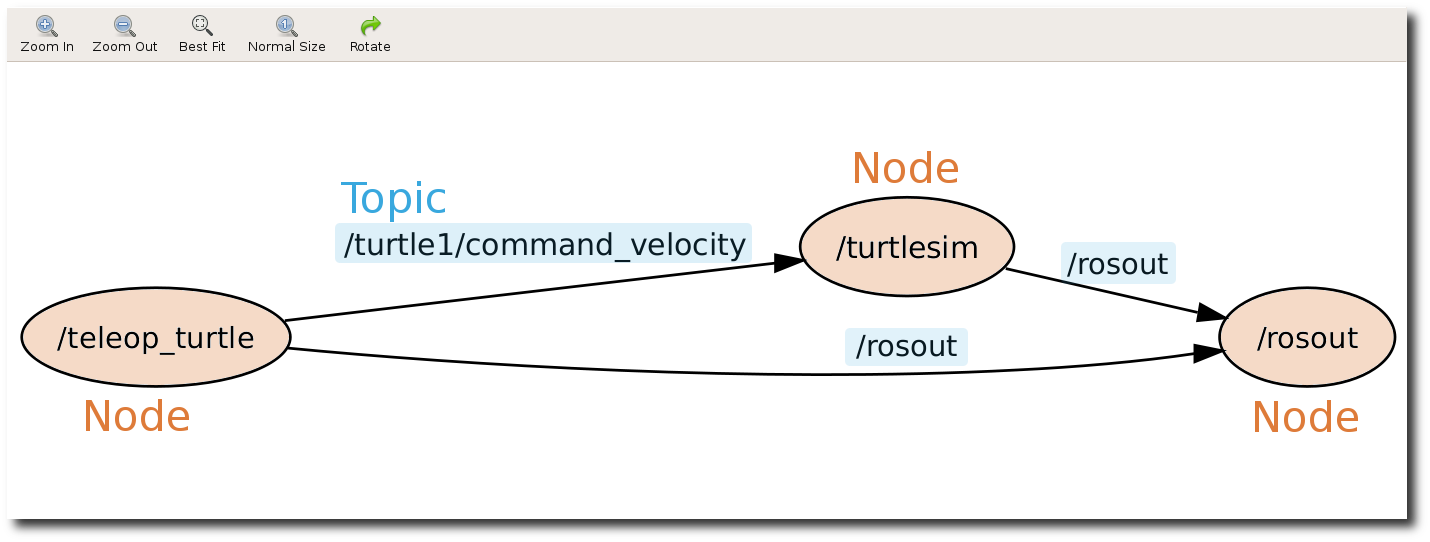
The turtlesim_node and the turtle_teleop_key node are communicating with each other over a ROS Topic. turtle_teleop_key is publishing the key strokes on a topic. While the turtlesim subscribes to the same topic to receive the key strokes. Let's use a new tool rxgraph which shows the nodes and topics currently running.
Using rxgraph
rxgraph creates a dynamic graph of what's going on in the system. rxgraph is part of the rxtools package. In a new terminal:
$ rxgraph
You will see something similar to:
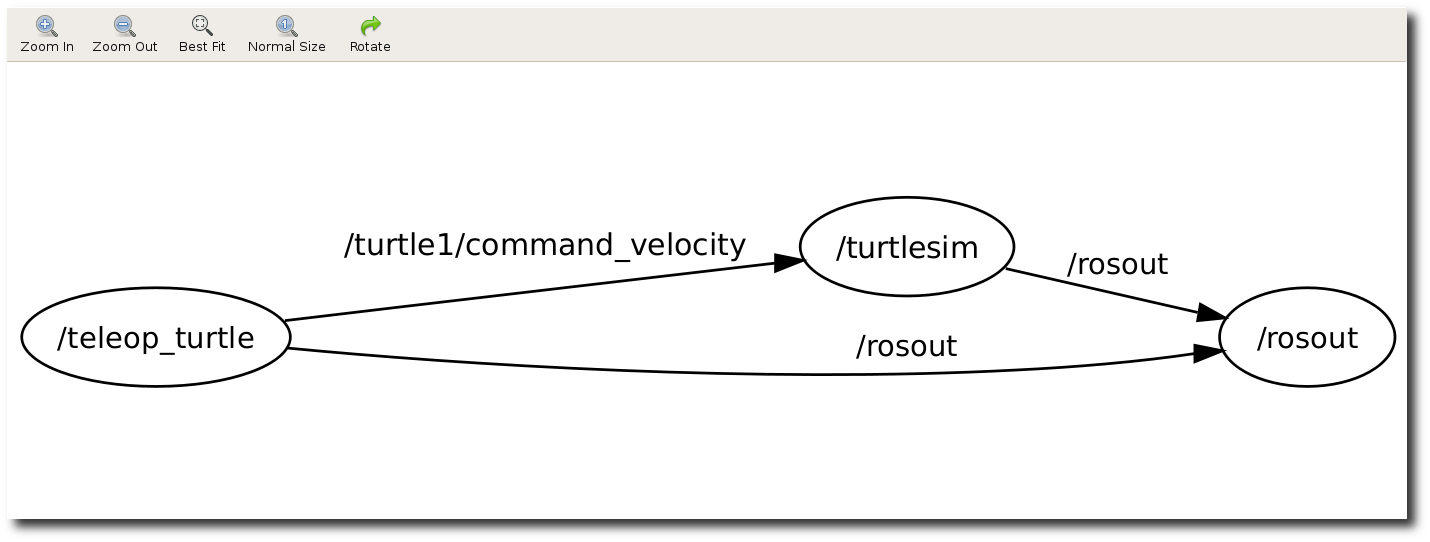
Here we have highlighted the ROS nodes and topics. As you can see that the turtlesim_node and the turtle_teleop_key nodes are communicating on the topic named /turtle1/command_velocity.
Introducing rostopic
The rostopic tool allows you to get information about ROS topics.
You can use the help option to get the available sub-commands for rostopic
$ rostopic -h
rostopic bw     display bandwidth used by topic
rostopic echo   print messages to screen
rostopic hz     display publishing rate of topic
rostopic list   print information about active topics
rostopic pub    publish data to topic
rostopic type   print topic type
Let's use some of these topic sub-commands to examine turtlesim.
Using rostopic echo
rostopic echo shows the data published on a topic.
Usage:
rostopic echo [topic]
Let's look at the data published on the /turtle1/command_velocity topic by the turtle_teleop_key node, in a new terminal:
$ rostopic echo /turtle1/command_velocity
You probably won't see anything happen, this is because no data is being published on the topic. Let's make turtle_teleop_key publish data by pressing the arrow keys. Remember if the turtle isn't moving you need to select the turtle_teleop_key terminal again.
Now you should see the following when you press the up arrow key:
---
linear: 2.0
angular: 0.0
---
linear: 2.0
angular: 0.0
---
linear: 2.0
angular: 0.0
---
linear: 2.0
angular: 0.0
---
linear: 2.0
angular: 0.0
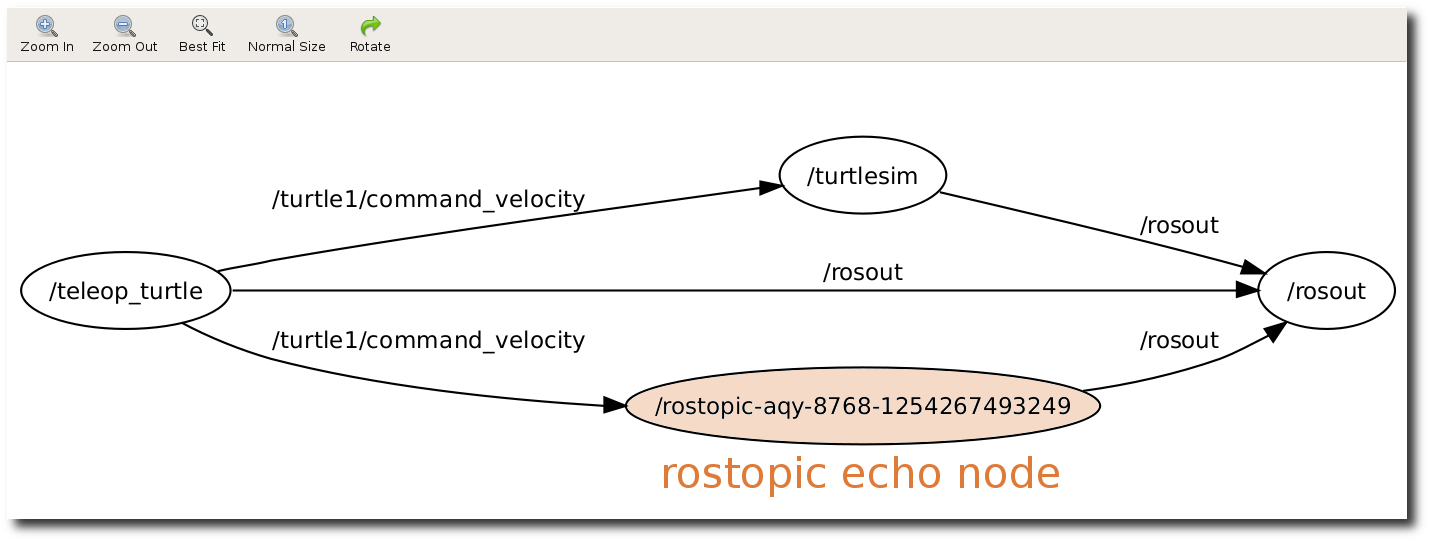
Now let's look at rxgraph again, as you can see rostopic echo is now also subscribed to the turtle1/command_velocity topic.
Using rostopic list
rostopic list returns a list of all topics currently subscribed to and published.
Lets figure out what argument the list sub-command needs. In a new terminal run:
$ rostopic list -h
Usage: rostopic list [/topic]

Options:
  -h, --help            show this help message and exit
  -b BAGFILE, --bag=BAGFILE
                        list topics in .bag file
  -v, --verbose         list full details about each topic
  -p                    list only publishers
  -s                    list only subscribers
For rostopic list use the verbose option:
$ rostopic list -v
This displays a verbose list of topics to publish to and subscribe to and their type.
Published topics:
 * /turtle1/color_sensor [turtlesim/Color] 1 publisher
 * /turtle1/command_velocity [turtlesim/Velocity] 1 publisher
 * /rosout [roslib/Log] 2 publishers
 * /rosout_agg [roslib/Log] 1 publisher
 * /turtle1/pose [turtlesim/Pose] 1 publisher

Subscribed topics:
 * /clock [unknown type] 3 subscribers
 * /turtle1/command_velocity [turtlesim/Velocity] 1 subscriber
 * /rosout [roslib/Log] 1 subscriber
ROS Messages
Communication on topics happens by sending ROS messages between nodes. For the publisher (turtle_teleop_key) and subscriber (turtlesim_node) to communicate, the publisher and subscriber must send and receive the same type of message. This means that a topic type is defined by the message type published on it. The type of the message sent on a topic can be determined using rostopic type.
Using rostopic type
rostopic type returns the message type of any topic being published.
Usage:
rostopic type [topic]
Try:
$ rostopic type /turtle1/command_velocity
- You should get:
turtlesim/Velocity
We can look at the details of the message using rosmsg:
$ rosmsg show turtlesim/Velocity
float32 linear
float32 angular
Now that we know what type of message turtlesim expects, we can publish commands to our turtle:
rostopic continued
Now that we have learned about ROS messages let's use rostopic with messages.
Using rostopic pub
rostopic pub publishes data on to a topic currently advertised.
Usage:
rostopic pub [topic] [msg_type] [args]
Example:
$ rostopic pub -1 /turtle1/command_velocity turtlesim/Velocity -- 2.0 1.8
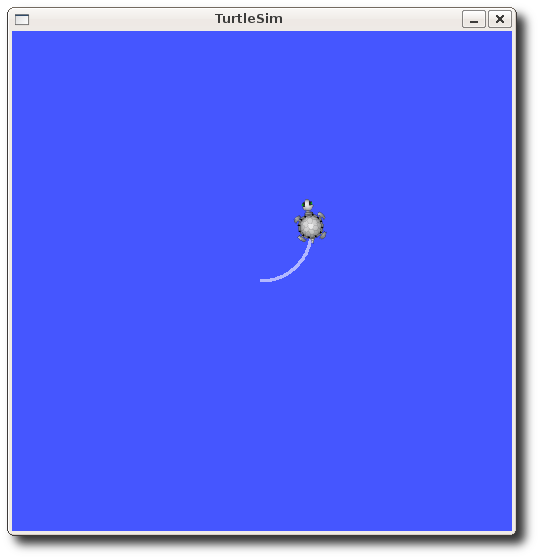
The previous command will send a single message to turtlesim telling it to move with an linear velocity of 2.0, and an angular velocity of 1.8 .
This is a pretty complicated example, so lets look at each argument in detail.
rostopic pub
- This command will publish message's to a given topic.
-1
- (dash-one) This option causes rostopic to only publish one message then exit.
/turtle1/command_velocity
- This is the name of the topic to publish to.
turtlesim/Velocity
- This is the message type to use when publishing the topic.
--
(double-dash) This tells the option parser that none of the following arguments is an option. This is required in cases where your arguments have a leading dash - (such as with negative numbers).
2.0 1.8
As noted before, a turtlesim/Velocity msg has two floating point elements : linear and angular. In this case, 2.0 becomes the linear value, and 1.8 is the angular value.
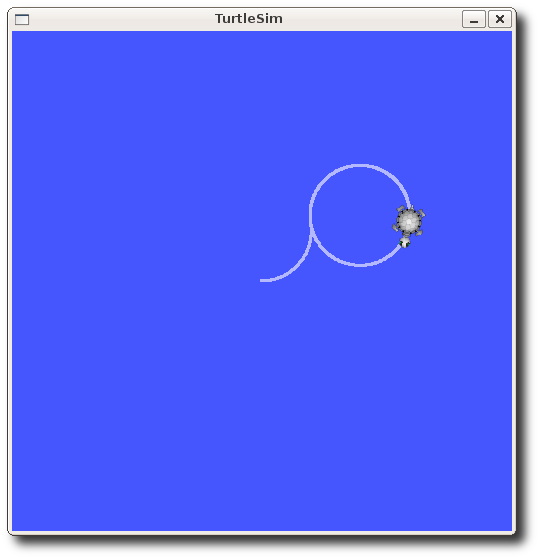
As you can see the turtle stopped moving, this is because the turtle requires a steady stream of commands at 1 Hz to keep moving. We can publish a steady stream of commands using rostopic pub -r command:
$ rostopic pub /turtle1/command_velocity turtlesim/Velocity -r 1 -- 2.0 -1.8
This publishes the velocity commands at a rate of 1 Hz on the velocity topic.
We can also look at what is happening in rxgraph:
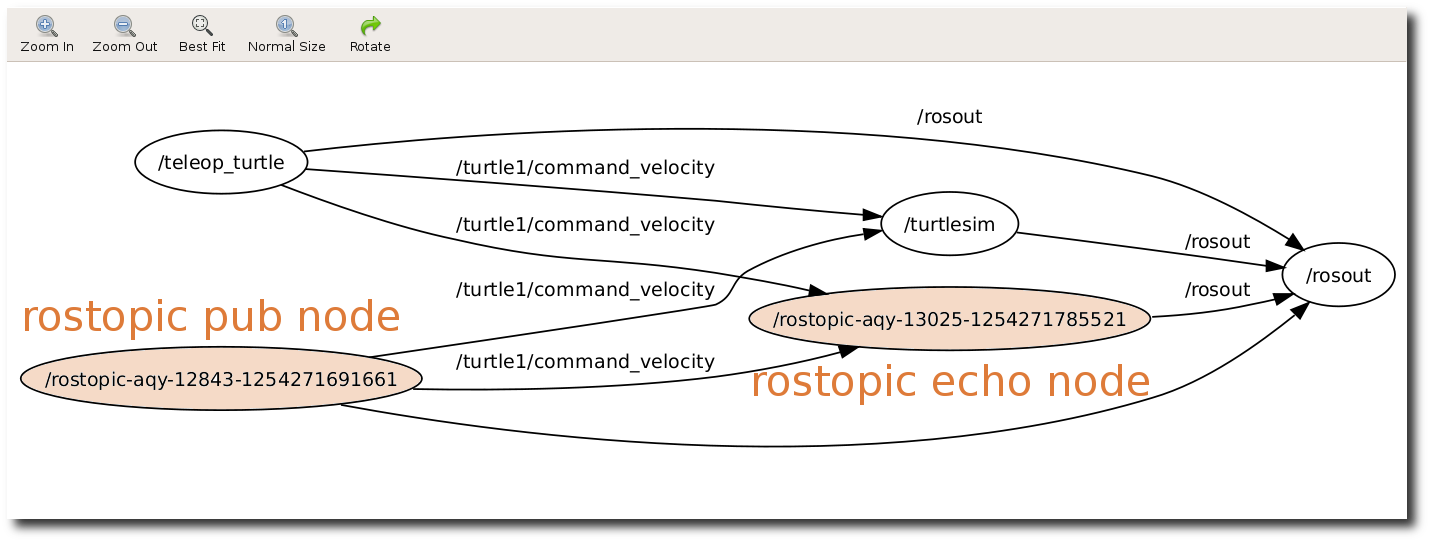
As you can see the turtle is running in a continuous circle. In a new terminal, we can use rostopic echo to see the data published by our turtlesim:
Using rostopic hz
rostopic hz reports the rate at which data is published.
Usage:
rostopic hz [topic]
Let's see how fast the turtlesim_node is publishing /turtle1/pose:
$ rostopic hz /turtle1/pose
You will see:
subscribed to [/turtle1/pose]
average rate: 59.354
        min: 0.005s max: 0.027s std dev: 0.00284s window: 58
average rate: 59.459
        min: 0.005s max: 0.027s std dev: 0.00271s window: 118
average rate: 59.539
        min: 0.004s max: 0.030s std dev: 0.00339s window: 177
average rate: 59.492
        min: 0.004s max: 0.030s std dev: 0.00380s window: 237
average rate: 59.463
        min: 0.004s max: 0.030s std dev: 0.00380s window: 290
Now we can tell that the turtlesim is publishing data about our turtle at the rate of 60 Hz. We can also use rostopic type in conjunction with rosmsg show to get in depth information about a topic:
Now that we've examined the topics using rostopic let's use another tool to look at the data published by our turtlesim:
Using rxplot
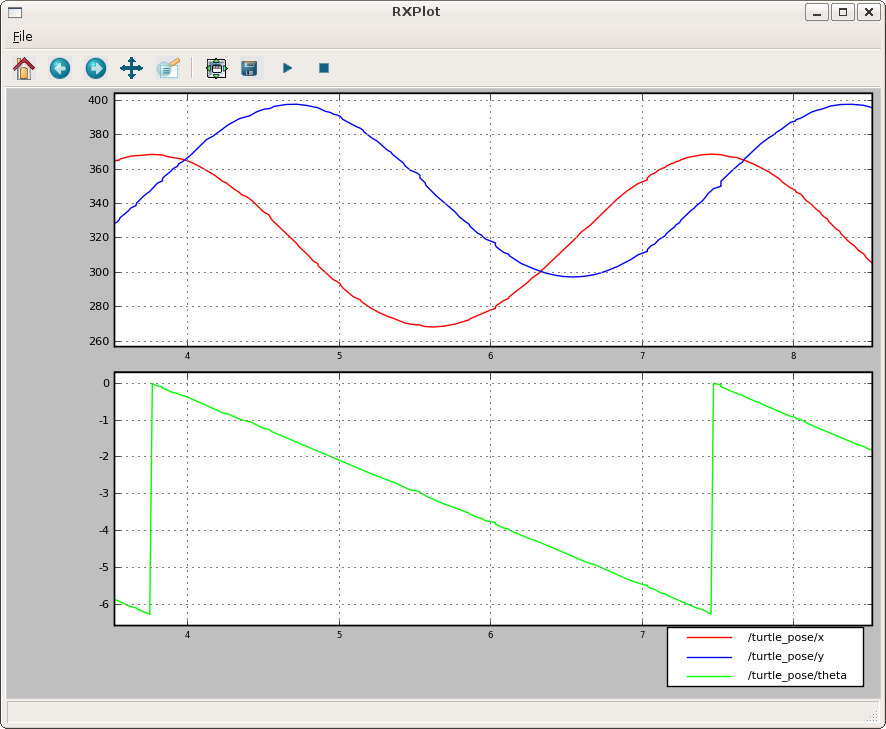
rxplot displays a scrolling time plot of the data published on topics. Here we'll use rxplot the data being published on the /turtle1/pose topic:
$ rxplot /turtle1/pose/x,/turtle1/pose/y /turtle1/pose/theta
You will see the turtle's x-y location plotted in the top graph while the turtles theta is displayed on the lower graph:
That's it for this section, use Ctrl-C to kill the rostopic terminals but keep your turtlesim running.
Now that you understand how ROS topics work, let's look at how services and parameters work.


