| |
How to use the visualization nodes
Description: This tutorial shows how to use the different visualization nodes provided by asr_ismTutorial Level: BEGINNER
Contents
Setup
1. Set the following described parameter:
param/sqlitedb.yaml: dbfilename should contain the path to the database, which contains the data you want to visualize and baseFrame should name the coordinate frame (see tf) you want to use.
param/visualization.yaml: visualization_topic defines the topic to which the visualization will be published (see !visualization_msgs::MarkerArray).
launch/*.launch: sceneName selects the scene/pattern you want to visualize.
These parameters are used similarily in every visualization node; if additional parameter exist they will be described in the particular tutorial part.
2. Start rviz.
rosrun rviz rviz
3. Make sure that baseFrame exists e.g. via rviz:
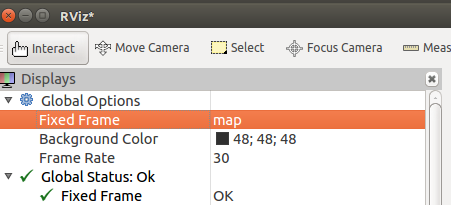
or run a tf tool like tf_monitor
rosrun tf tf_monitor
or just publish baseFrame yourself with a static_transform_publisher
static_transform_publisher x y z yaw pitch roll frame_id child_frame_id period_in_ms
e.g.
static_transform_publisher 0 0 0 0 0 0 arbitrary_id baseFrame 100
Tutorial
recordViewer
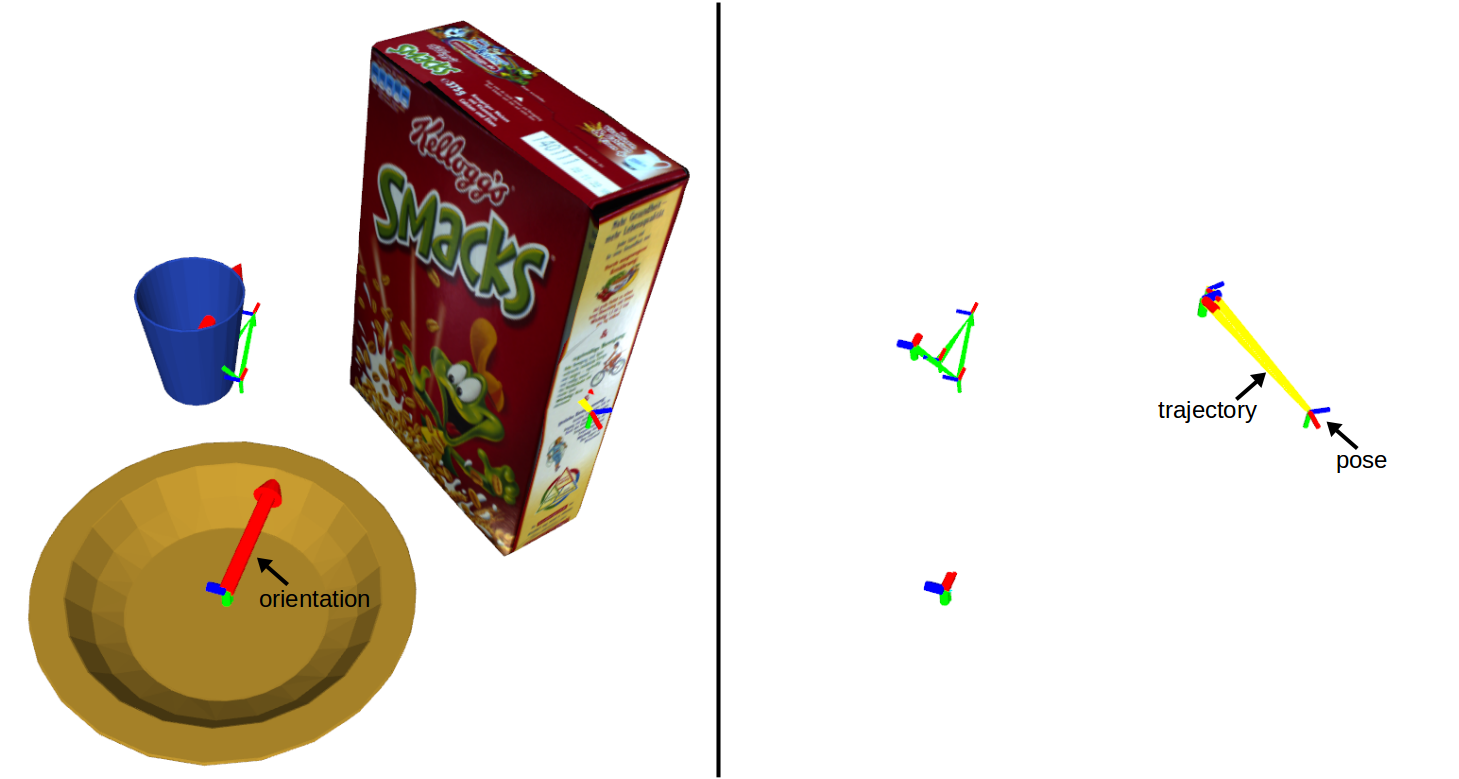
Picture 1: Left: Visualization generated by the recordViewer. Right: Same as left picture with hidden object mesh and orientation.
To start the recordViewer just call
roslaunch asr_ism recordViewer.launch
in the terminal. The node will start to publish the visualization which can be observed in rviz. Picture 1 shows an example of the visualization for a recorded scene. It shows the mesh and orientation of each object from the database belonging to the selected scene at the first pose of the objects trajectory. The remaining trajectory is visualized as lines between the recorded poses which are represented as coordinate axis. The axes use the rgb-to-xyz color-code from ROS.
To close the visualization process press ctrl+c.
modelViewer
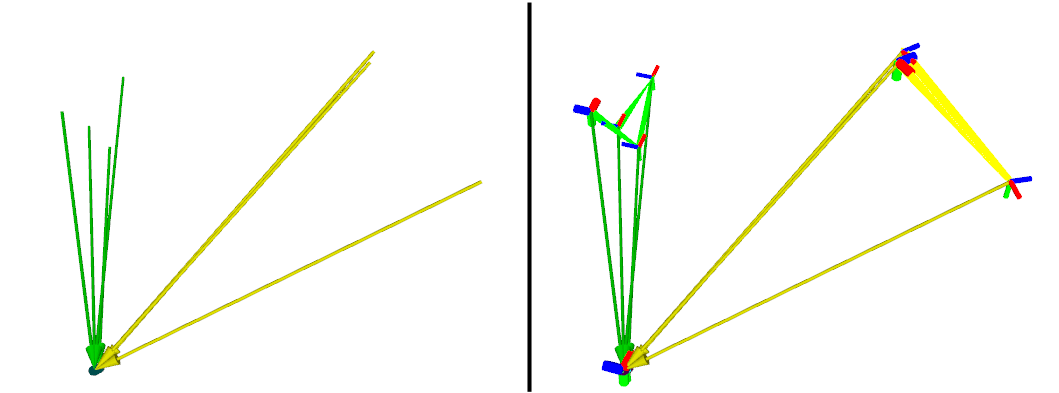
Picture 2: Comparison of the visualization generated by the modelViewer without and with the visualization of the recordViewer
The modelViewer can be started just like the recordViewer:
roslaunch asr_ism modelViewer.launch
You should always use the modelViewer in addition to the recordViewer, because the modelViewer only visualizes the votes from the object poses to the corresponding reference pose and therefore makes only sense if these poses are visualized too (see comparison in Picture 2).
Keep in mind to use the same parameters for the modelViewer as you did in the recordViewer and don't forget to train a model beforehand.
voteViewer
The voteViewer provides two modes, which can be selected right after the startup of the node. You can run the voteViewer like usual by calling:
roslaunch asr_ism voteViewer.launch
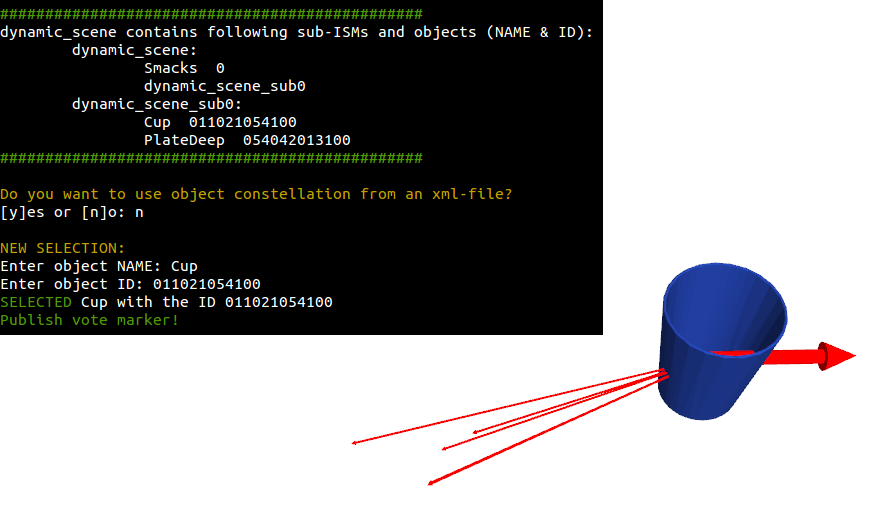
Picture 3: Terminal output and visualization without using a object configuration from an xml-file
Picture 3 shows the visualization of the voteViewer in the mode without using an object configuration from an xml-file. In this mode you can select an object by passing the object name and id, from a list shown in the terminal, to the node. The selected object will be visualized with a pose at the origin (0,0,0) and the identity quaternion (w=1,0,0,0) as orientation (large red arrow); furthermore the votes will be visualized originating from this pose. This visualization provides the user with the information where this object would predict a scene reference.
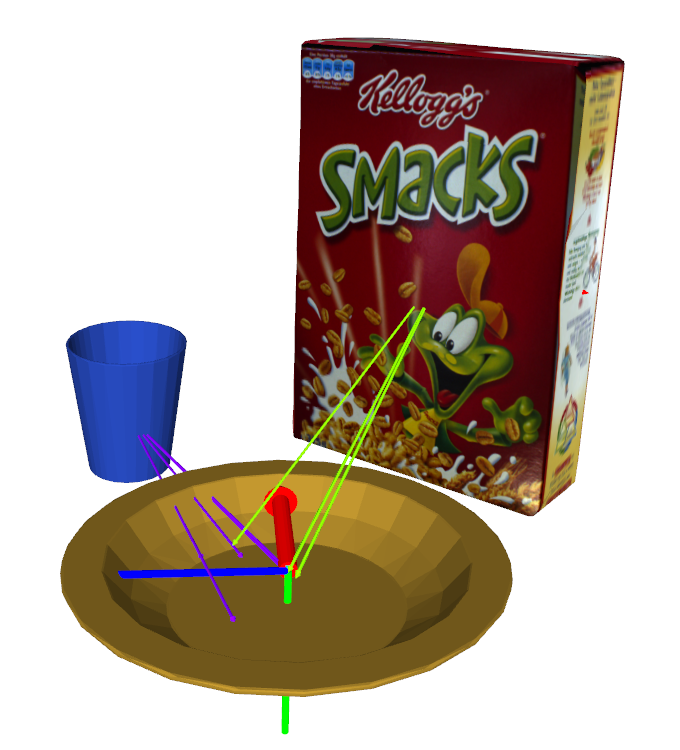
Picture 4: Visualization with an object configuration from an xml-file.
If you want to use the mode which uses an object configuration, you have to set the parameter “config_file_path” in the voteViewer launch-file (“launch/voteViewer.launch”). Such an object configuration can be generated with the object_configuration_generator (see asr_ism) or can be saved while using the recognizer.
This mode visualizes the whole scene from the object configuration file and adds votes for the objects, for which the database with the selected scene (sceneName) has data for (see Picture 4). If possible the reference of a (sub)scene will be visualized as coordinate axes. With this visualization the user can visualize what voting outcome the given object configuration would generate.


