| |
General asr_psm Tutorial
Description: This tutorial gives a short overview over all the steps in the use of asr_psm, from learning to recognition of scenes.Tutorial Level: BEGINNER
Contents
Tutorial
Objects which are posted into the stereo/objects frame can be collected into a database file with an ism component (asr_ism recorder).
Learner: Adjust the file and scene names in the learner.launch file (see asr_psm). Use the bagfile containing the scene graph recording from before:
input_db_file: the database file containing samples
scene_model_name: Name of the output .xml file containing the model.
scene_model_directory: Where to save the file.
Start the learner with roslaunch asr_psm learner.launch. After the results are written to the .xml file specified in the launch file, you can terminate the program with Ctrl+C.
If you would like to use combinatorial optimization to find relations between the objects rather than a heuristic based on how parallel the trajectories are (which is the default), use combinatorial_learner.launch instead. This will increase learning time notably, but generally select relations that lead to more accurate recognition results.
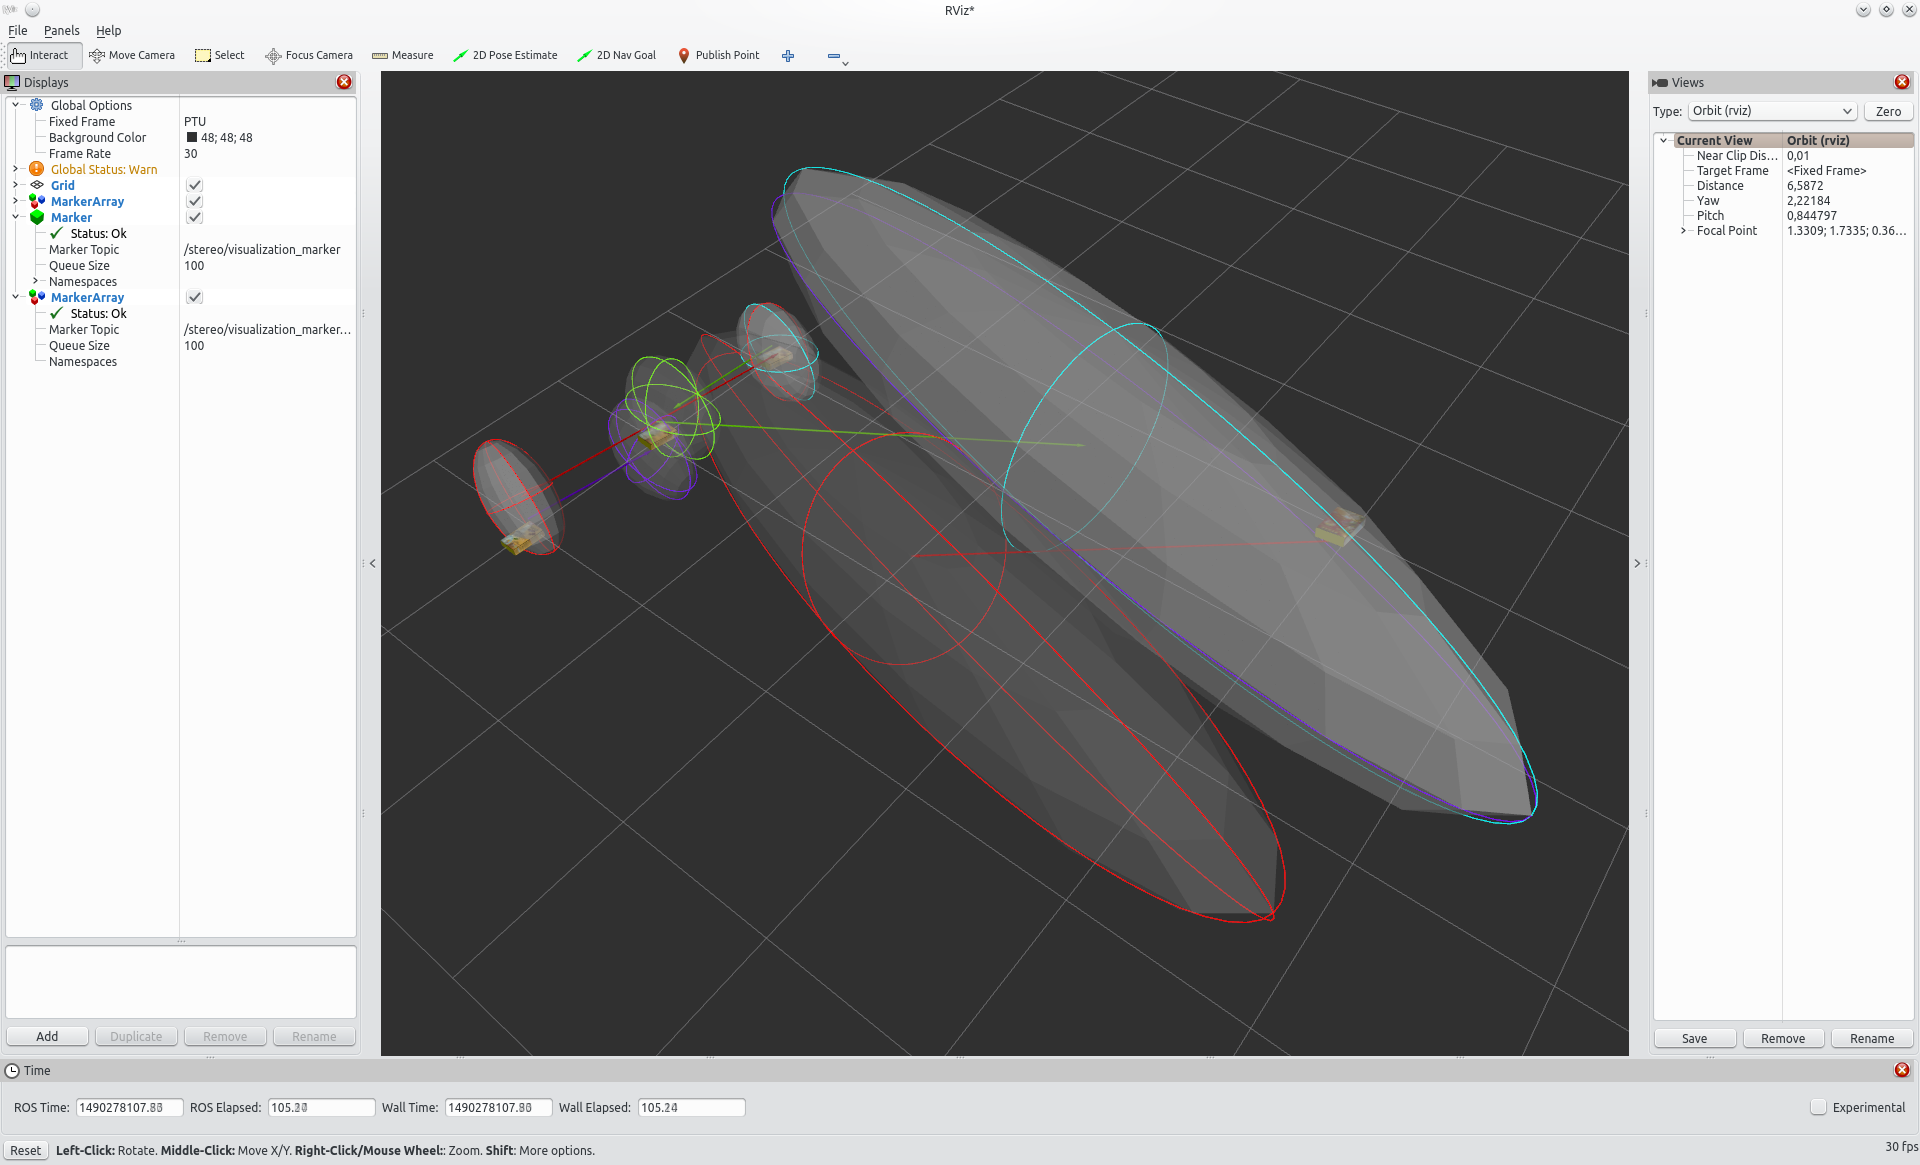
The results are visualized in RViz, through the package asr_psm_visualizations. Set the frame (here: /PTU) and subscribe to /psm to show the gaussian mixture models created by the learner to describe object relations in position.

To visualize the relation in terms of orientation, which is considered separately, set the orientation_plot_path in the launch file to something other than "UNDEFINED". Now, gnuplot data will both be written into timestamped files on this path and, if a gnuplot screen terminal like gnuplot-io is installed, also be displayed on screen. For each kernel, three plots are generated which represent it in roll, pitch and yaw. Because of this, activating the feature when using a large number of kernels is not recommended.

Inference: Adjust the filenames and scene name in the inference.launch file. The .xml file created by the learner contains the learned model. Launch inference with roslaunch asr_psm asr_psm inference.launch.
bag_filenames_list: path to the bag file containing the data used for learning, see above.
scene_model_filename: .xml model file. Use full path here instead.
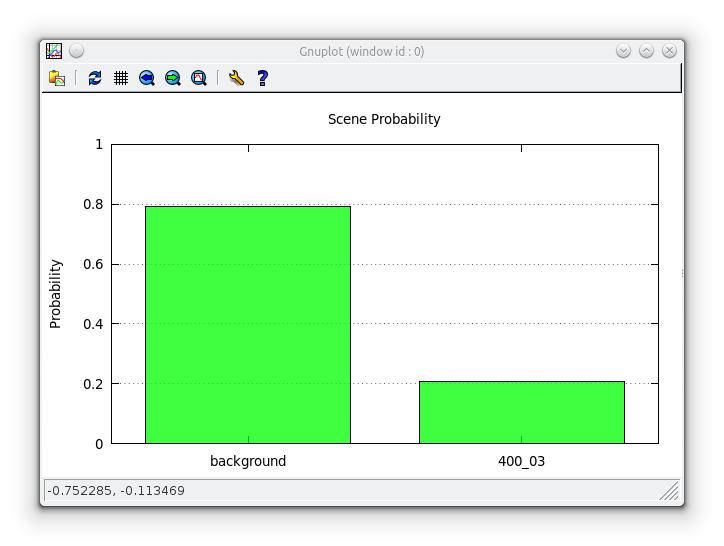
As soon as object observations (evidence) arrive, either live from the recording and object recognition setup or from rosbag replays, the inference node outputs the probability that the obeserved objects describe the scene in the model. Output occurs on terminal and, if installed, als a gnuplot bar diagram.

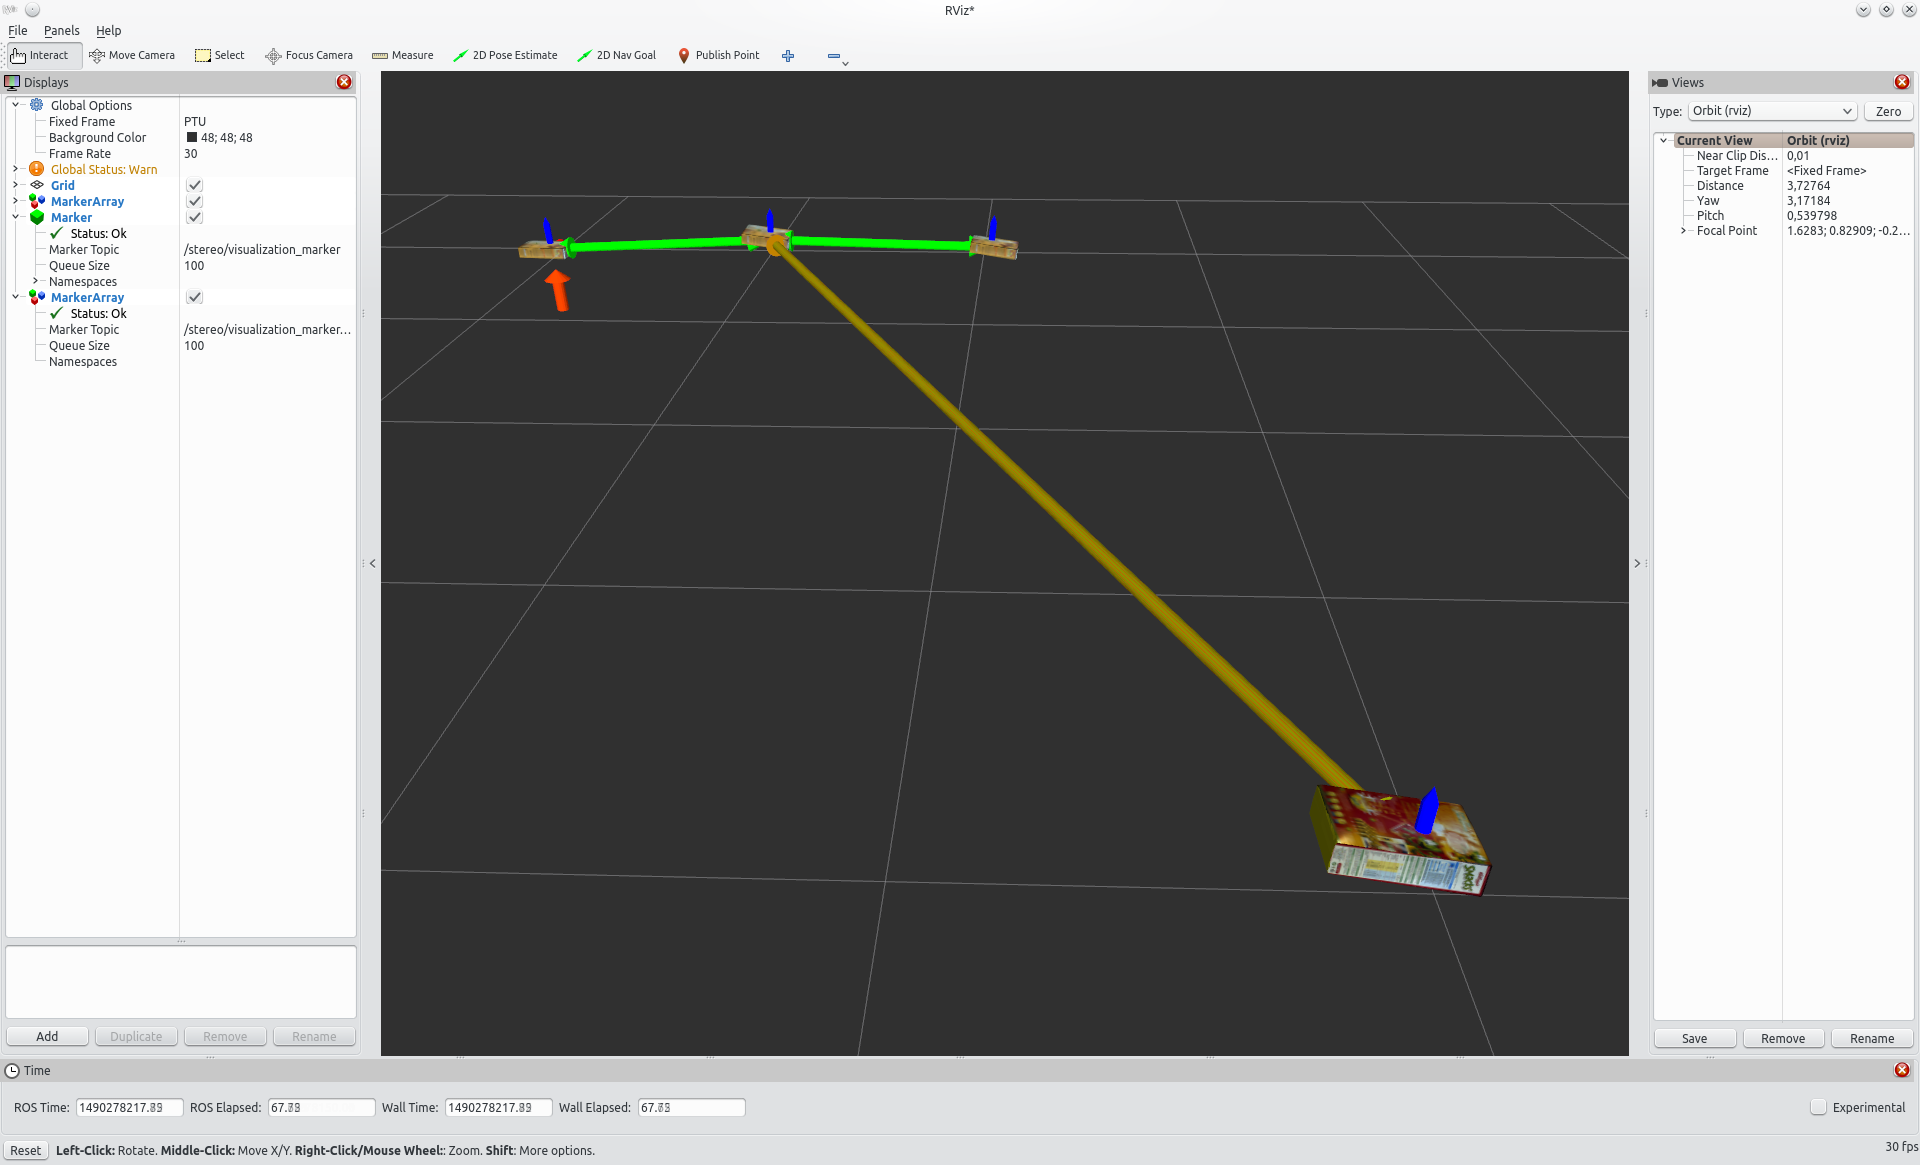
In RViz (set up as above), the relation graph is visualized as arrows. Their colour indicates the proabability that this relation is satisfied by the observations, from red (worst) through orange and yellow to green (best). The single vertical arrow pointing to one of the objects (which are at the ends of the other arrows) indicates the reference object, its colour depending on the scene probability.

You can input several scene observations in each session. Once you are done, close the inference node with Ctrl+C. If you are using gdb as terminal, which is set as default in inference.launch, confirm quitting with y.
If instead of gdb you want to use the the standard console, remove the launch-prefix in the launch file and replace it with output="screen".
You will have to close the gnuplot window by hand.
Common mistakes
If the inference node shut down in an irregular fashion, the gnuplot window may persist. In this case, you will have to kill the process manually.


