| Note: This tutorial assumes that you have completed the previous tutorials: ROS tutorials. |
| |
Starting the Runtime Monitor
Description: The runtime_monitor is a useful tool for monitoring the state of your robot. It subscribes to the "/diagnostics" topic and displays the data into a simple, easy to use, format.Tutorial Level: BEGINNER
Contents
Overview
The Runtime Monitor (in the rqt_runtime_monitor package, runtime_monitor before Groovy) displays raw diagnostics data by listening to the "/diagnostics" topic. It's useful for viewing diagnostics data in real time.
For robots with a diagnostic_aggregator, the rqt_robot_monitor is recommended. Generally, small or simple robots will not have a diagnostic Aggregator, so users will have to use the runtime monitor.
Build
Install ROS if you haven't already, then build the Runtime Monitor:
$ rosdep install rqt_runtime_monitor
$ rosmake rqt_runtime_monitor
Run
Setting the correct master
First, make sure your ROS master is pointed at the right place.
$ echo $ROS_MASTER_URI
It should give you something like:
http://localhost:11311/
If "localhost" isn't the name of your robot, set your master:
$ export ROS_MASTER_URI=http://COMPUTER_NAME:11311/
If this is a robot you'll be using often, it might be nice to set an alias for that master. Add the following line to your "~/.bashrc.ros":
$ alias NAME='export ROS_MASTER_URI=http://COMPUTER_NAME:11311/'
Replace NAME and COMPUTER_NAME with appropriate nickname and computer name of your machines.
Starting the monitor
It's easy with rosrun:
$ rosrun rqt_runtime_monitor rqt_runtime_monitor
Before Groovy:
$ rosrun runtime_monitor monitor
Viewing Data
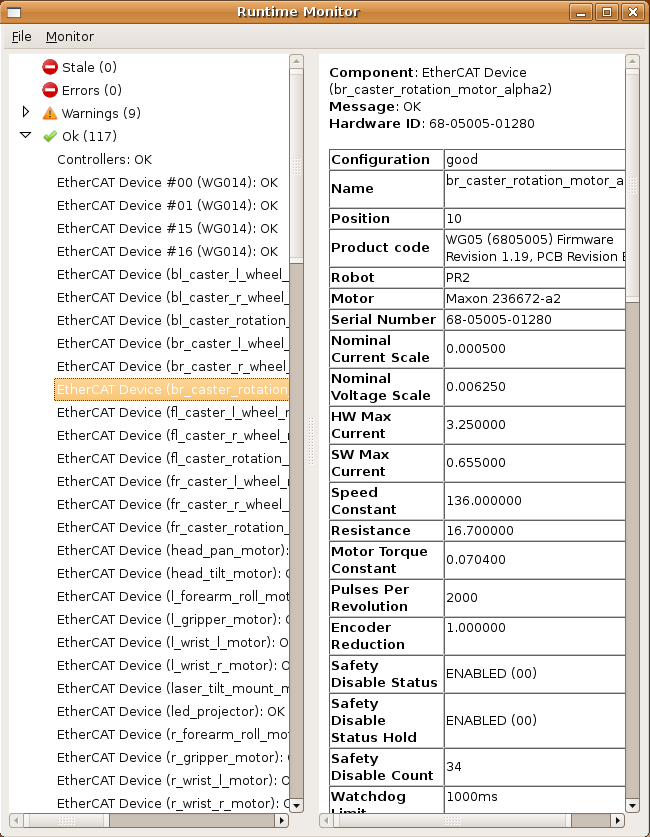
In the left side of the screen, the diagnostics data will be displayed by name. They will be categorized according to status, as "Stale", "Error", "Warning" or "OK".
To view the complete state of an item, click on it, and the data will appear in the right window. By scrolling around in the window, you can track view the status, and watch for changes.

Additional Features
Resetting the Monitor
After an item stops publishing diagnostics for about 5 seconds, it will move to the "Stale" header in the left side of the monitor. To clear stale items, use the "Monitor >> Reset Monitor" in the menu. The monitor will quickly repopulate with all current items.
Changing topic
In some cases, diagnostics will not be published on "/diagnostics". To change the topic, use the "Monitor >> Change Topic" option in the menu.
IMPORTANT: The runtime monitor can only listen to topics of type "diagnostics_msgs/DiagnosticArray".
Shortcuts
Some users like to set an alias for the runtime monitor, too.
$ alias runtime='rosrun runtime_monitor monitor'
Now typing:
NAME
runtime
Will open a runtime monitor that subscribes to /diagnostics from computer "COMPUTER_NAME".


