| |
Viewing Logged Diagnostics in rqt_bag
Description: Use launch files or bonds and a service to add a new set of analyzers to the aggregator.Tutorial Level: INTERMEDIATE
Contents
Overview
The rqt_robot_monitor package includes an rqt_bag plugin that can be used to view diagnostics data directly in rqt_bag. If you have rqt_bag and rqt_robot_monitor installed, this plugin will be loaded automatically.
rqt_bag requires a roscore. If you don't have a roscore running, start one:
roscore
In a new terminal, run rqt_bag on a bag that contains diagnostic data (the /diagnostics or /diagnostics_agg topic):
rqt_bag my_data.bag
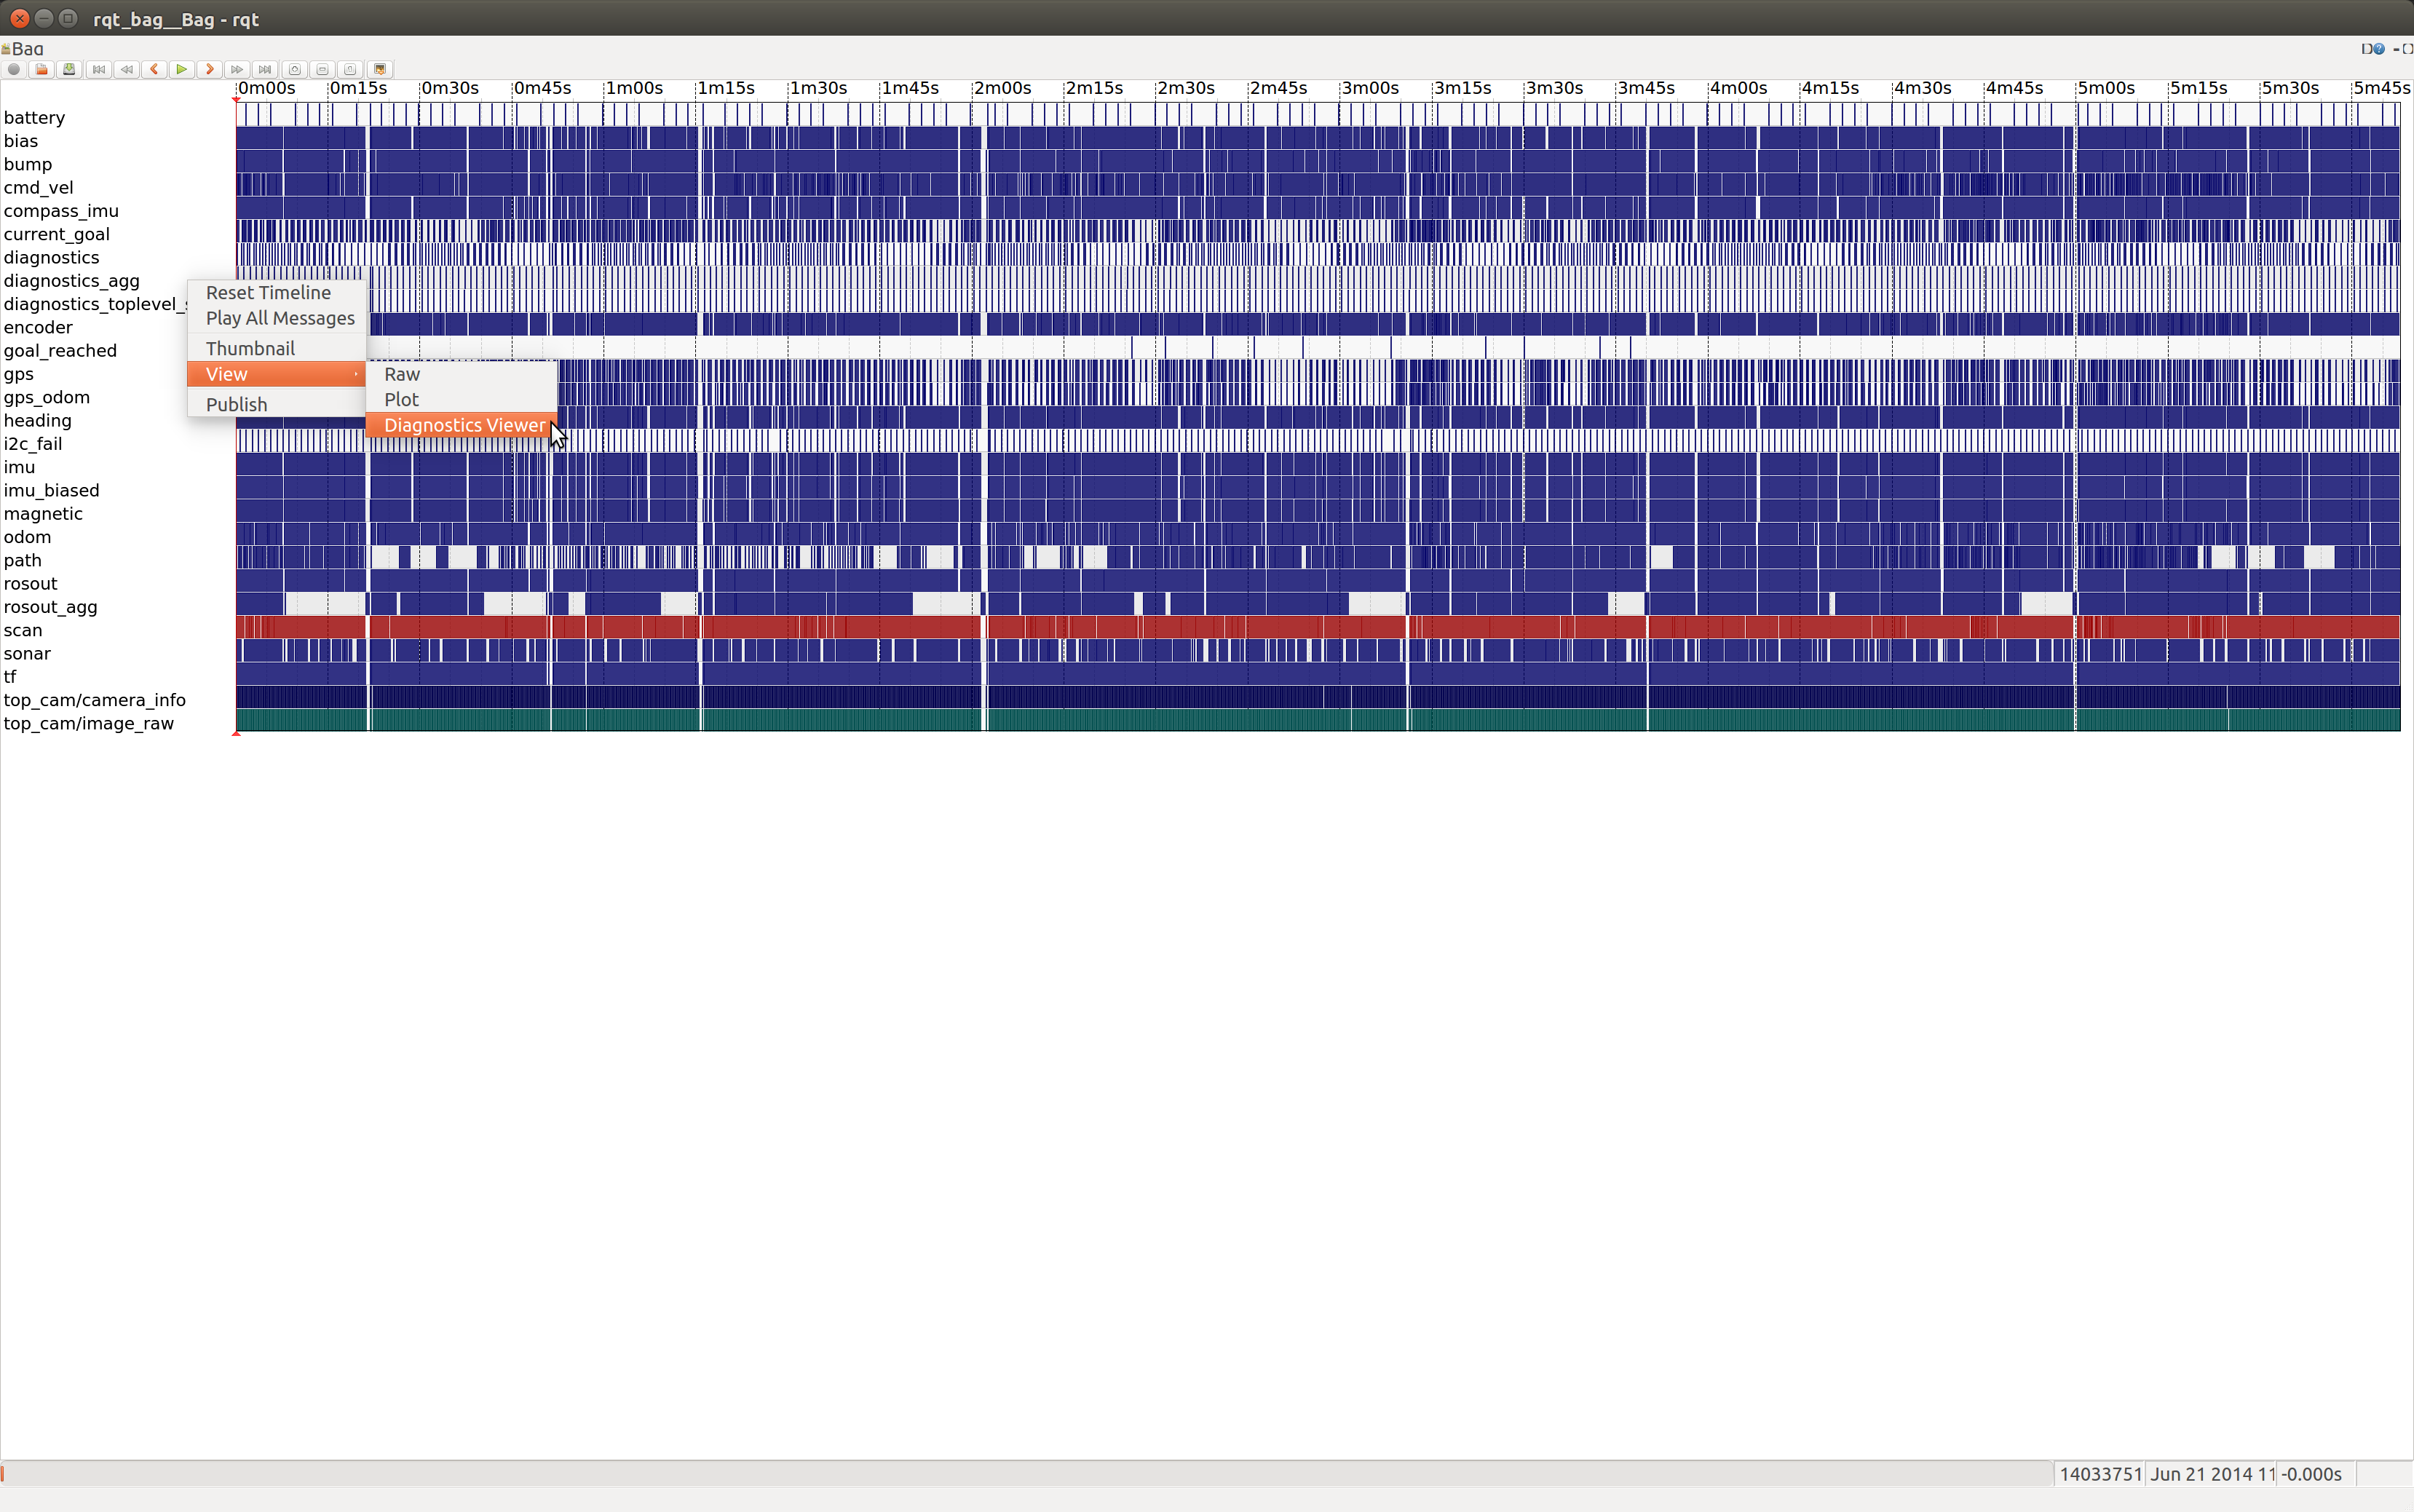
When rqt_bag opens, right-click on the diagnostics_agg topic to visualize it:

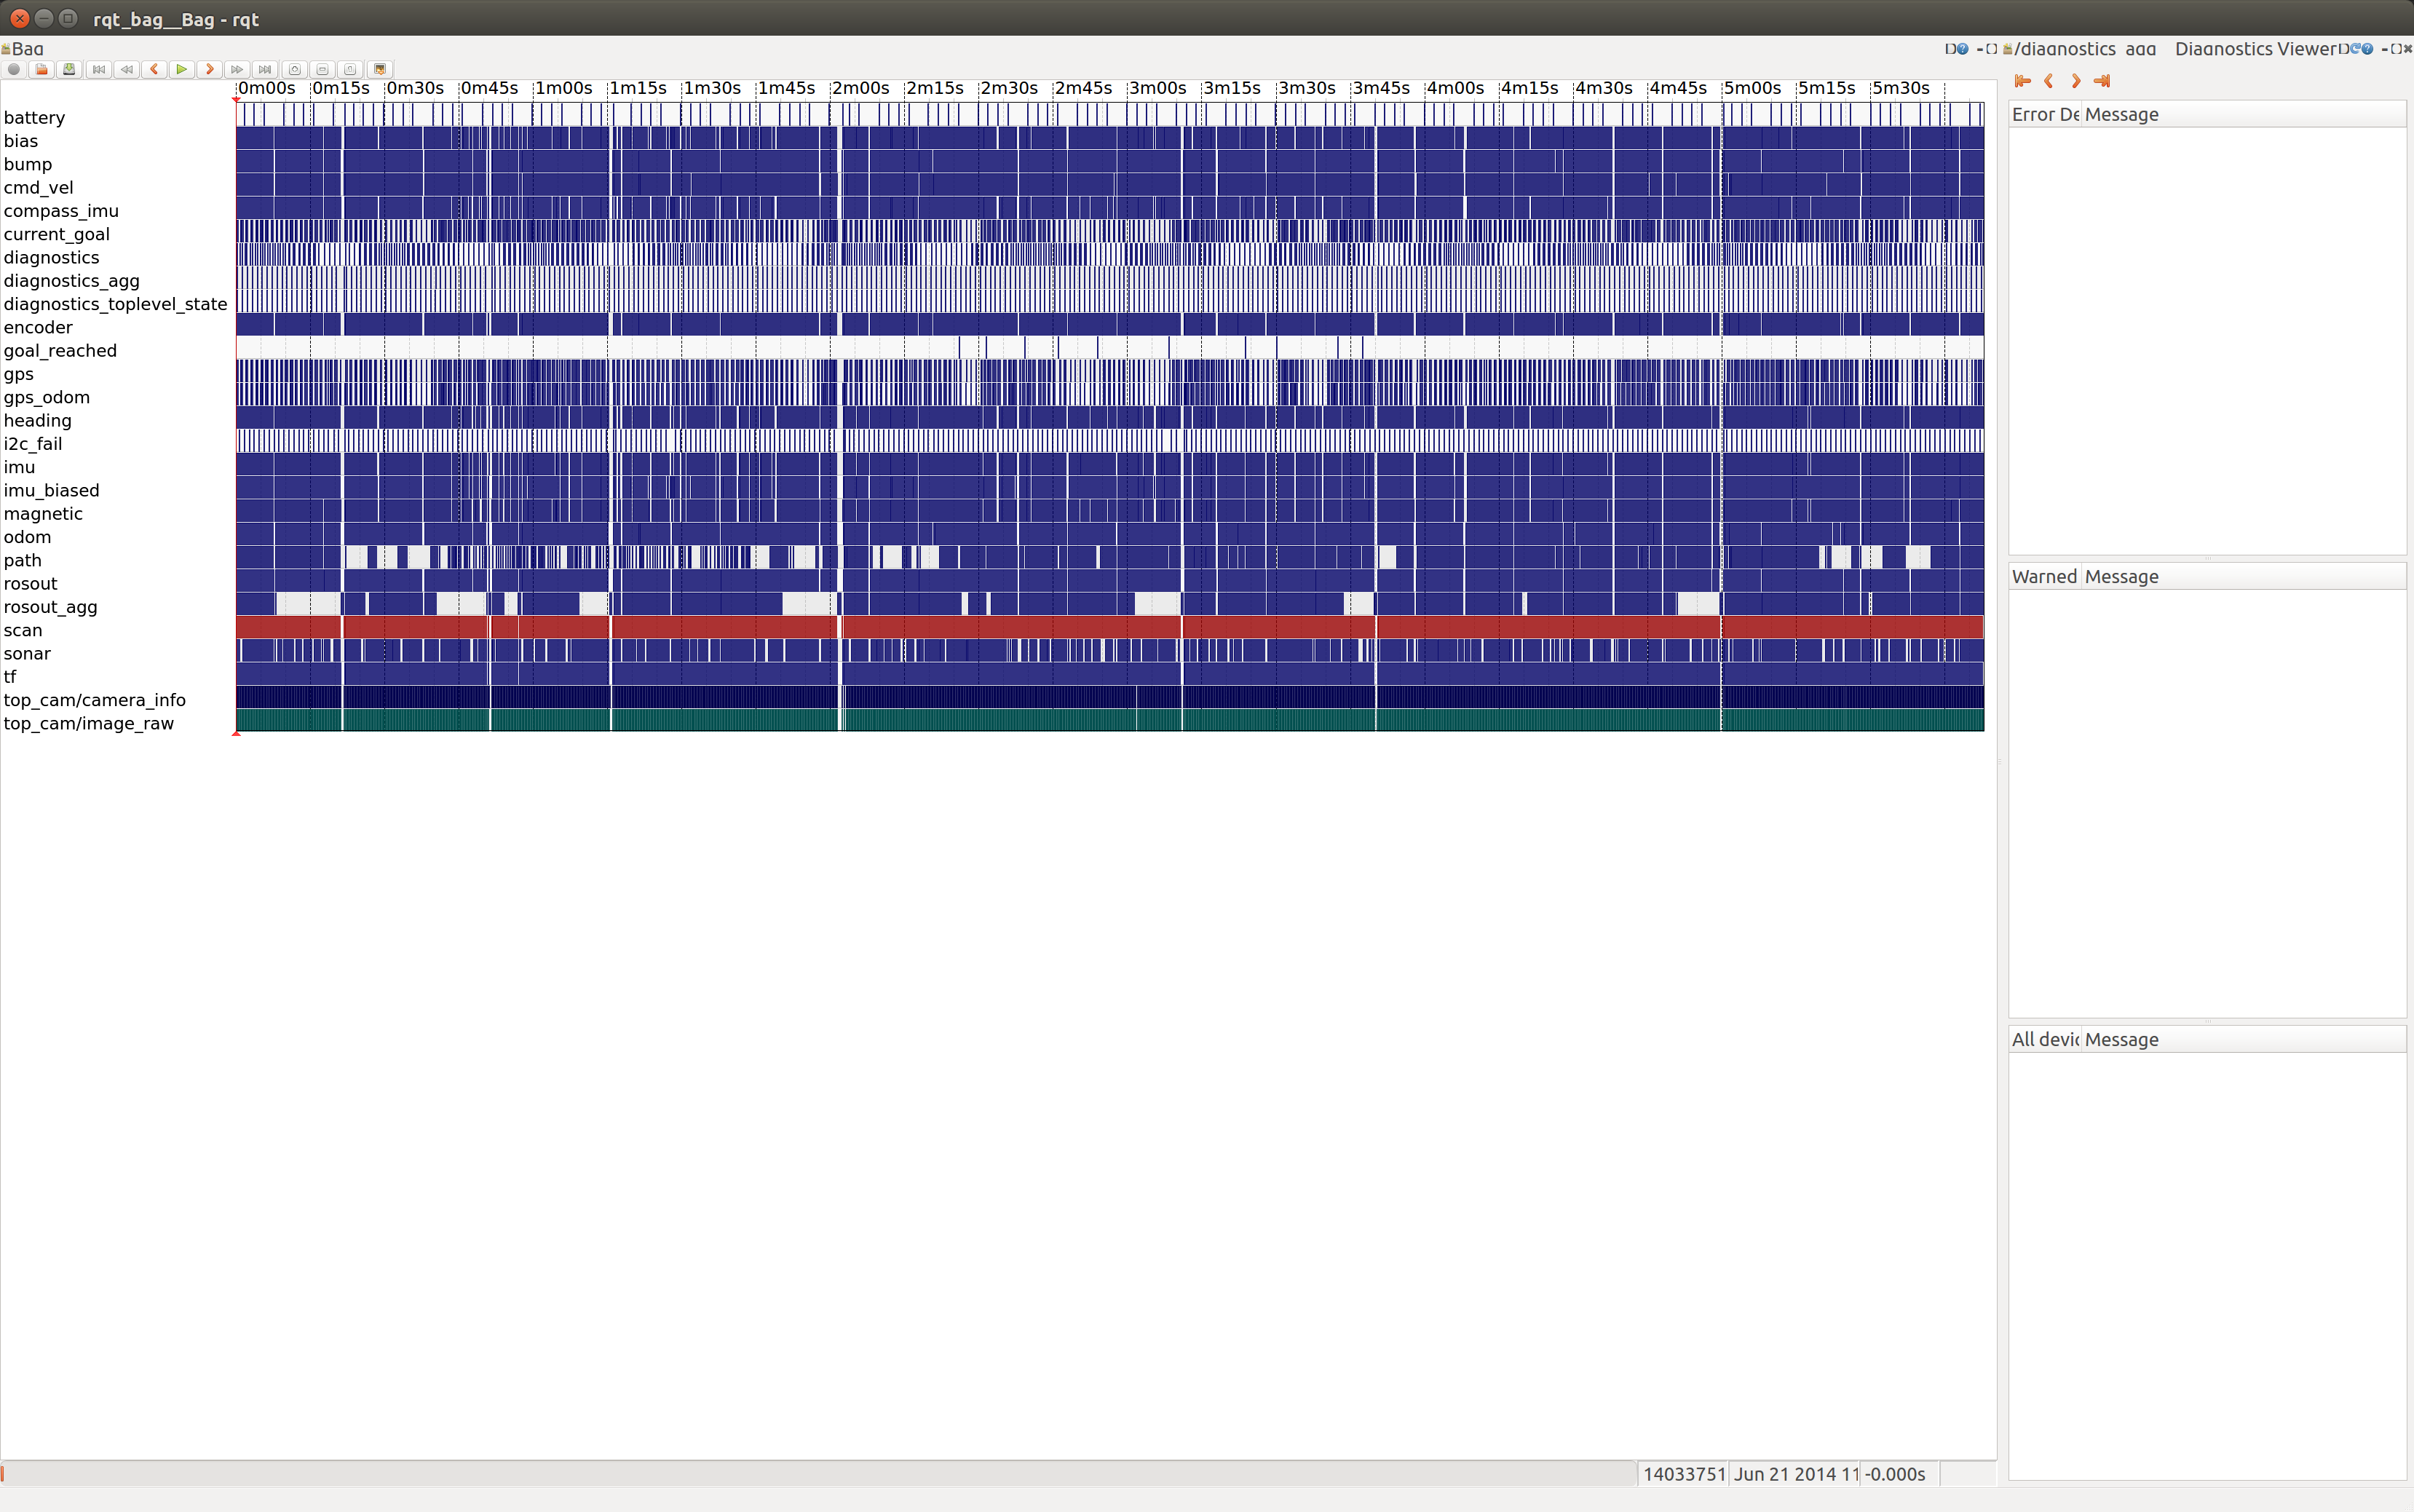
The diagnostics viewer may appear poorly formatted, and will be empty. I prefer to position it on the right side of the screen, like this:

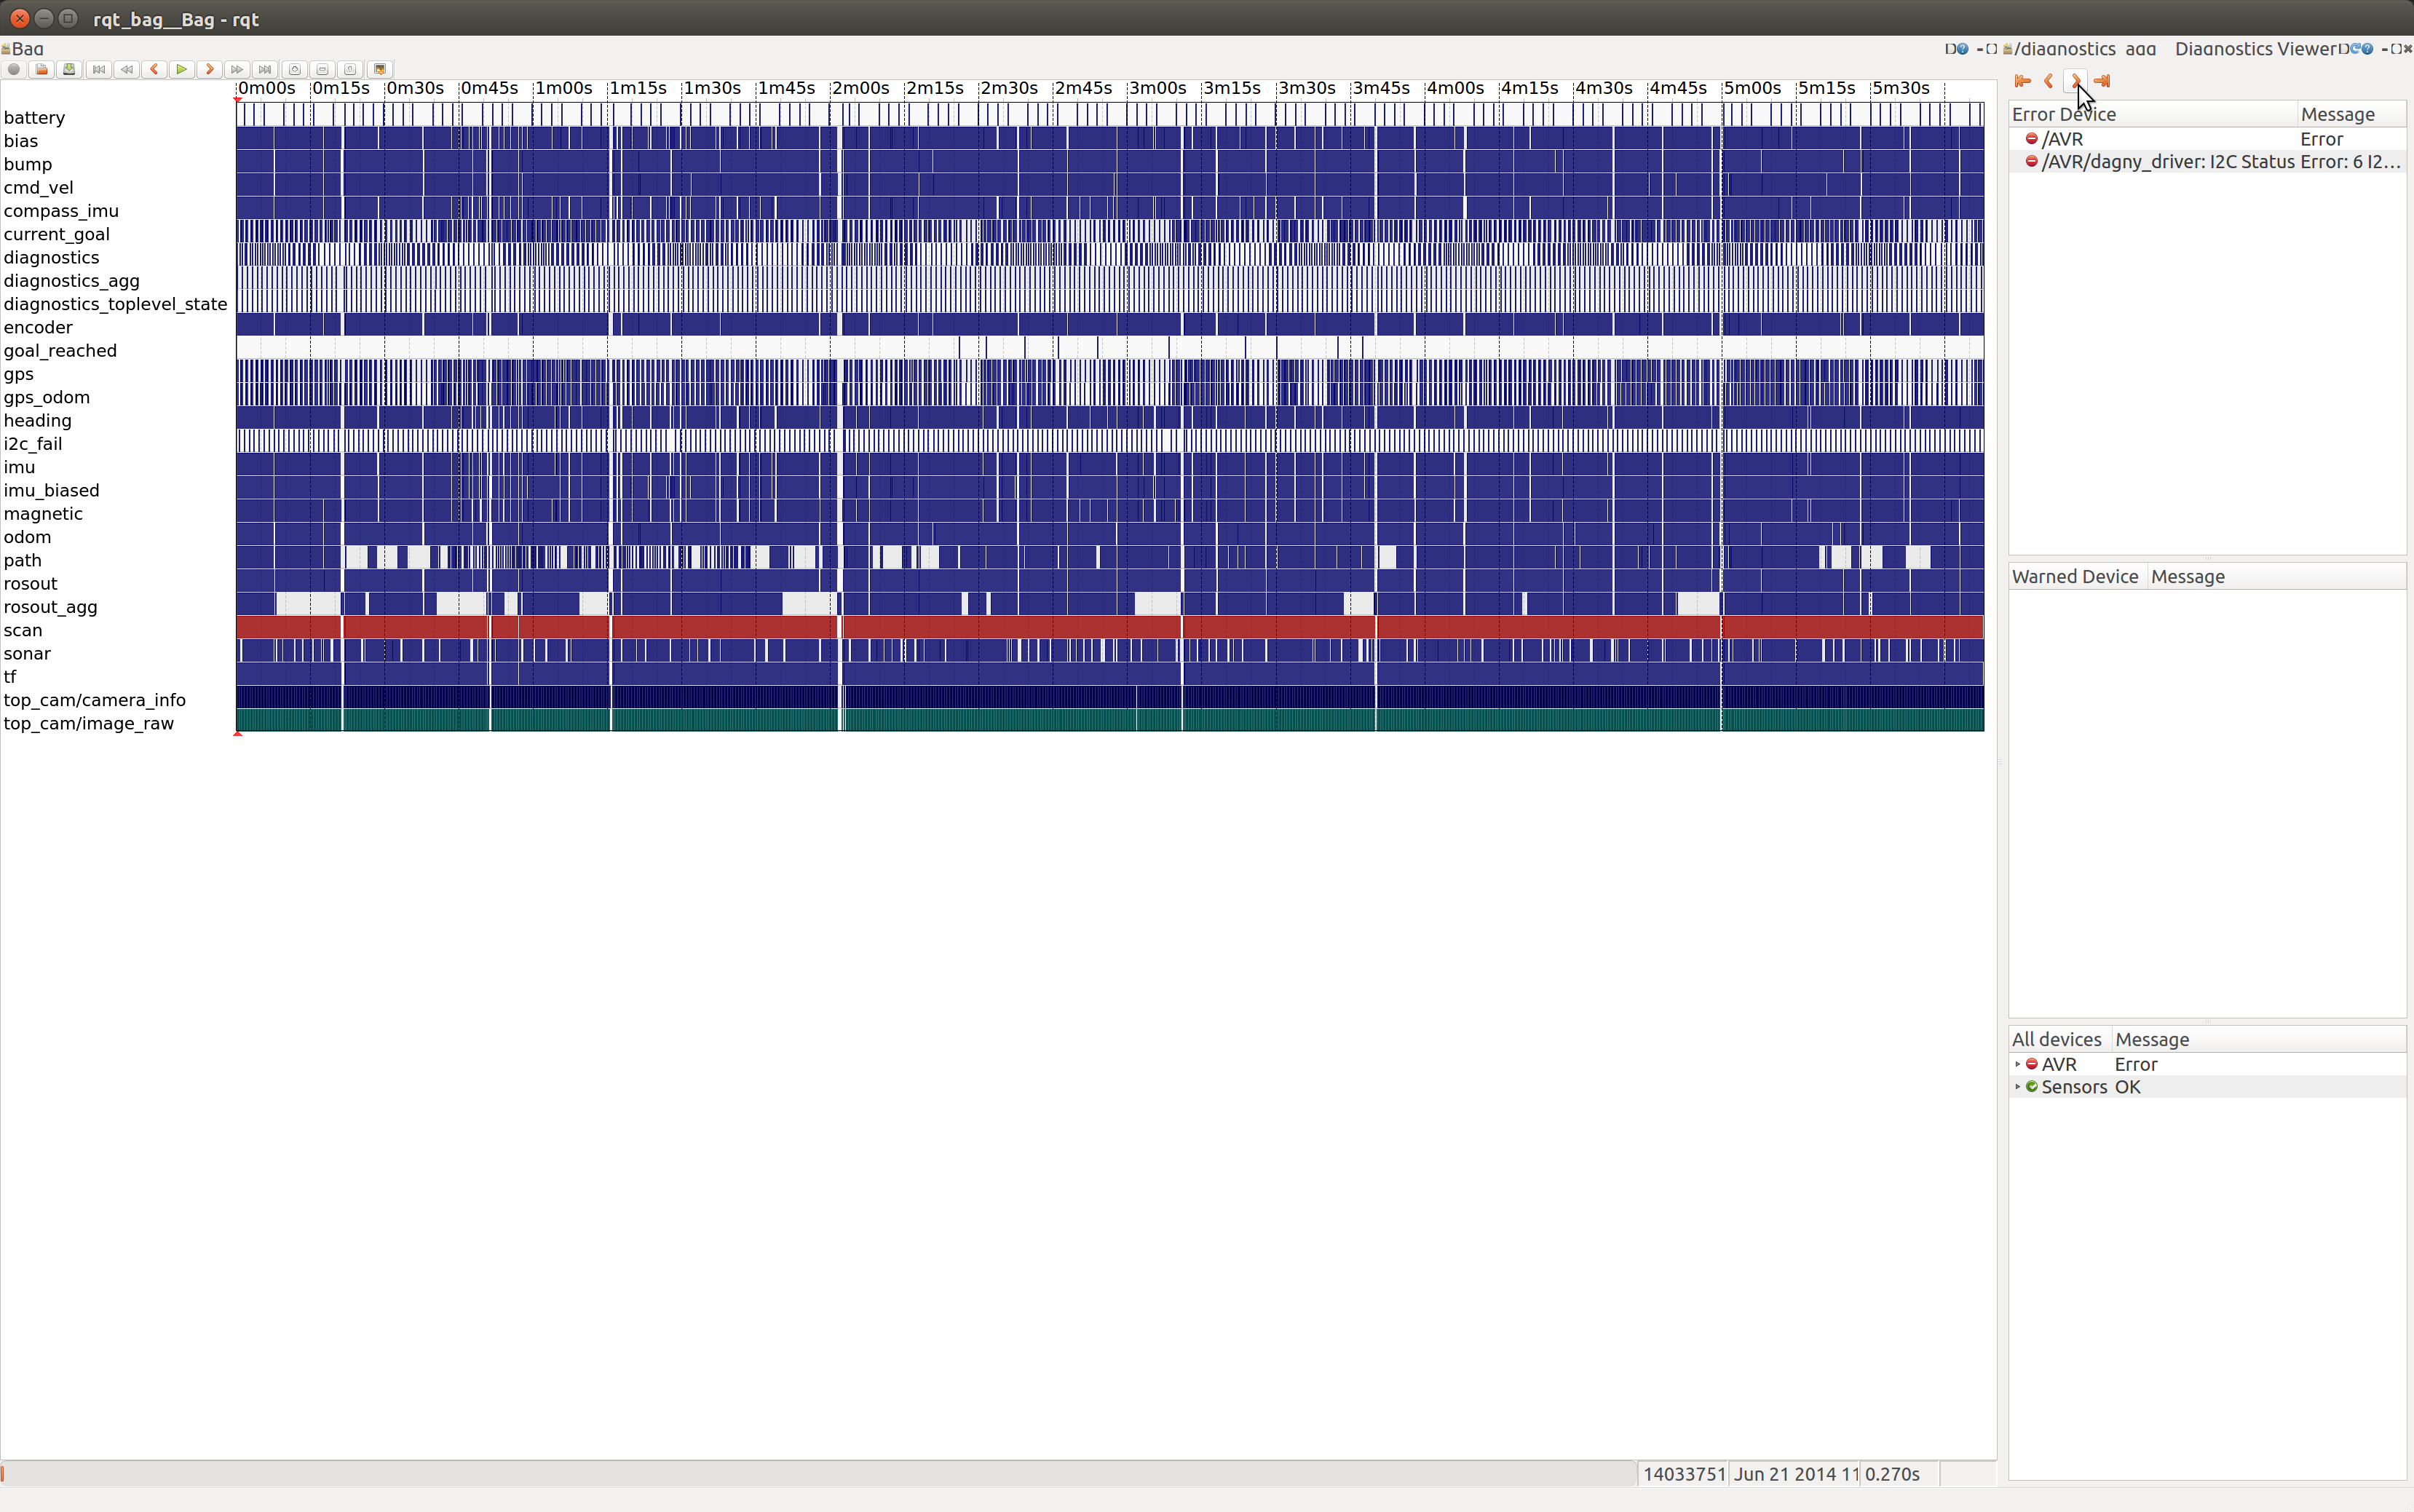
Now you can use the playhead to seek through your log file, or the arrow buttons to move through the diagnostics one message at a time:

(Here you can see that my robot had some I2C problems at the beginning of this log)


